

Podcast: Play in new window | Download
We’re going back to a topic that circles the indexed universal life Insurance wagon. This subject comes up from time to time, and the core question is: is indexed life insurance worth it? And, why do we assume the indexed credit interest rate that we do?
A percentage of you will know what we’re talking about and some will not—so let’s back up and explain what all of that is.
When it comes to indexed universal life insurance, the interest rate (that is earned on the cash value) is not fixed. It fluctuates, and it depends very much on the movement of an index and which index is being tracked.
For example, you could choose an index segment that follows the one-year change in the S&P 500 Index, typically referred to as a one-year point-to-point, which is most common. What that looks like is: from the beginning of the policy year to the end of the policy year, whatever the percentage change is in the S&P 500 Index is your corresponding interest earned on the cash value earned up to a certain limit—called the cap rate.
If the cap rate is 10% and the S&P 500 movement in the index is 7% for the year, then you’re going to get 7%. That’s going to be your effective interest rate on cash value in the policy.
On the other hand, if the S&P movement is up to 25%, then you’re going to cap at 10%.
Now when it comes to building proposals and projecting cash value, because of this variability, we have to have some way to look at the plan and speculate on what the cash value growth will be—because it will change every single year. But just like we can model projections for real investments in the stock market by assuming a certain interest rate will be earned effectively over the course of several years, we can do the same with indexed universal life insurance.
We can say—given the parameters, cap rate, and floor—”this is what we think will happen” and we can plug in an interest rate that is assumed in all years that generates value that we think are the closest to reality.
Assumed Interest Rates for IUL Were the Wild West
For a long time, the interest assumption was left up to interpretation.
Insurance companies could say, “okay, this is the current floor and current cap rate, and if we go back 20/30/40 years and look at what the average index earning would have been over a period, that is the max amount of interest we can assume.”
And most departments of insurance looked at that, blessed it, and moved on. Or more likely, they didn’t look at it all that closely.
Then a couple years ago, we had a bit of a regulatory initiative that changed that.
The regulatory change defined the period that could be used to set the maximum and added another test that capped interest rate assumptions to a certain percentage over the average yield on assets over a certain period.
And it’s going to use the lesser of those two things: either a period look-back or the corresponding yield on your assets with a little increase over that to accommodate for the fact that you’re generating a return through options and not just the other assets inside the general account.
That effectively pulled the maximum assumed interest rate down. It didn’t change the functionality of indexed universal life insurance, but it changed what could be projected.
Prior to that, it was not uncommon to see projections up to 8% or more. There were times certain indexes were created—proprietary indexes—that gamed the system and allowed companies to assume higher interest rates. If you cherry pick the historical data, you can justify everything and build an index around it.
There are a couple problems with the approach that says: historically, this has been the average index earned so you can use this number. The problem is…when you take that average and make it a static assumed rate of return, year over year, you’ll discover that variability affects the ultimate results.
And we’ve proven in prior discussions on The Insurance Pro Blog Podcast that you can take a company’s stated average over a thirty-year period (maximum illustrated amount), and you could take actual results from the S&P 500 over a similar period, and what you would discover is using this sort of backtesting results, you would achieve less favorable results in the policy than the max illustratable rates to project values.
In other words, if you just used an assumed maximum rate of (let’s say) 7.75% and built projections on that- then decided not to use a static but instead historical data from 1985 – 2015– and looked at how those compared (cash value results, income) you discover the actual results are actually worse than that static 7.75% assumption. That happens because of the timing of actual rates-of-return matter.
The sequence of returns risk is not just something we talk about with respect to how you’re going to distribute income from an investment in the market, given variation and returns, but it’s also something we must think about in terms of what our actual result will be. And that risk isn’t absolved by using indexed universal life insurance.
Solid for instance: 10-year period. For the first five years, person A gets 2%, and for the last five years gets 10%. Then, there’s person B with the same amount of money and same 10-year period. The only difference is: for the first five years, person B got 10% and for the last five years, got 2%. Who has more money in year 11? Person A. Why? Because person A was earning a higher rate of interest on a larger sum of money.
Their average rate of return is the same. But the timing of those returns matters.
That example is simple, but there all sorts of examples where you can mix the returns up and get the same average of return and have varying amounts of money at the end of the period.
This is important for you to understand and it’s also why it’s not tragic to have early years where you’re flat in a new indexed universal life insurance policy. In fact, it’s probably a conversation that investment advisers should be having with their clients who start on a new investment plan.
What’s more dangerous is when you get bad years later. That’s when results are non-linear. People who started their IRA with $5,000 in 2008, no big deal. People who had five million in an account that went through 2008 had it much worse. The percentage was the same but there were very different outcomes.
If that is part of the risk, then what gives IUL a leg up? The ability to not go negative. If you have the five million, you’re not going to lose 40%. I’d say that’s a pretty big deal.
So back to the question: is indexed universal life insurance worth it?
The reason we went through this, is to say the interest rate that we assume on indexed universal life insurance is not a number we are assuming will be the average. We don’t expect to put IUL into force and then twenty years from now, look at it and expect it to have hit that interest rate assumption.
That’s not the plan. The reason behind the number is to create a variable that we can plug into this equation that gets us to where we think this is going to go. That number is derived from a whole lot of thought processes that take place behind the scenes.
That is what we want to make clear. Whatever number is being used, if done correctly, is not about assuming what is going to happen.
If you’re looking at IUL as a broker or buyer, and that discussion starts with “for the past thirty years this has been the average indexed interest earned…” you’re headed down the wrong road. We shouldn’t be justifying the indexed assumed interest by saying, “thirty years ago to today the average…therefore we can assume this in a linear fashion for the next thirty years.”
There’s one of two things that will happen if you do that. Either you’ll be very disappointed, or you’ll be elated. But the number in the middle, the one you calculated, is the one that will be wrong.
Averages warrant an entirely separate conversation.
If you go back and you look at historical returns (not even in IUL)—just take look at the S&P 500.
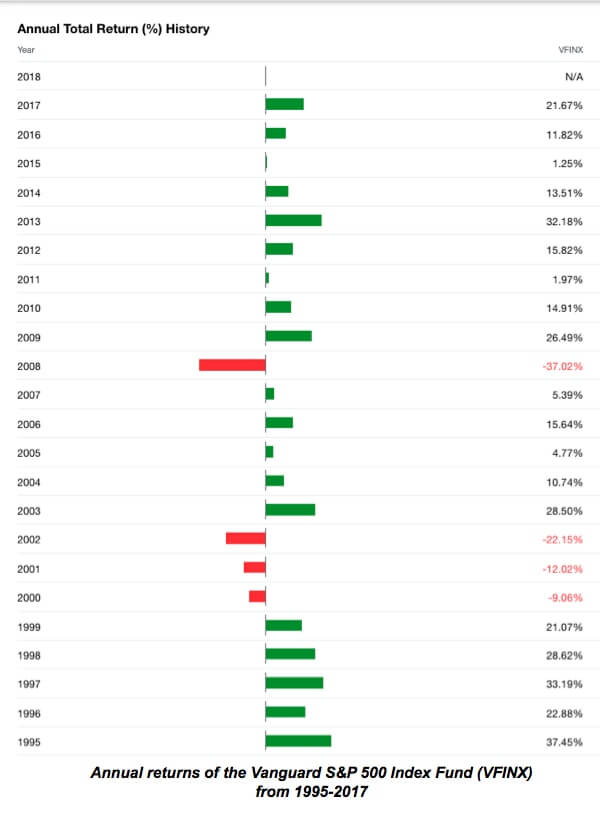
In general, there a not a lot of 4% and 5% years. You see quite a few home runs and a few big-time stinkers.
There’s not a lot of bumping around the average. And we would speculate that if there was, indexing for insurance products wouldn’t be able to get off the ground, at least not in the fashion they do today. Because the volatility and movement in the market is a crucial step to making the derivative contracts that must be bought to make this happen valuable enough to pay the interest.
If an insurance company is going to buy a derivative on the S&P 500 Index and the realistic expectation is that it’s not going to go up any more than 7%, there’s not going to be enough value appreciation in that contract to create an interest rate anywhere near 7% on an indexed universal life insurance policy.
Now to be clear, this doesn’t mean that the insurance company is screwing you and taking advantage of the fact that they’re earning more money than their paying you. We’re saying in the world of options pricing, in terms of how those options change in value, there needs to be more movement than just a couple of percentage points.
Time and volatility are factors in the pricing of those options.
The other thing to point out is the model that we have used to speculate what interest rate should be assumed also considers that things change. Five years ago, if we were to give you an example of how IUL worked, we probably wouldn’t use a cap rate at 10% because back then, cap rates were a lot higher than 10%. Today, that’s about average (unfortunately).
Now when we have looked at how these things might unfold, we’ve taken this kind of movement into consideration. If I were to go back and use the strict math at current cap rates, we could still assume higher interest rates than we do. But we want to assume that they might go down from there. And if that happens, it doesn’t change our expectations.
The general trend in cap rates in the last five or six years has been down. But look on the bright side, that means there’s plenty of room to go up from here.
Now, we need to revisit something from our past—the difference between average and the geometric mean, or the compound annual growth rate, which is a figure you get from the real return you got over a time.
Several years ago, there was a financial press writer who had written a piece very critical of Dave Ramsey. The core of his argument was that Dave would use averages as a number to speculate what someone would get if they invested in the market.
He’d most often use 12% because over a twenty-year period the average rate of return was a little over 12% in whatever mutual fund he was using as his example.
The writer’s counter was that the geometric return is way lower than that. Dave invited the writer onto his show, and Dave admits the guy is right. So, why not use 8%?
Dave basically told him, “it’s my show and I’ll do what I want,” but it was a clear admission from someone whose opinions are well-received that there is a big difference between the two.
You must realize that if you are using assumptions built on averages by taking a set of data that looks at what the return is over a certain period and adding those up and dividing by the number of years – if you use that figure to speculate on what your results will be over a period time in the future, you’re very likely to be incorrect.
It has a high probability of causing you to overestimate your outcome. That sort of math does not take into account the impact that timing of those returns has on your ultimate results.
And it plays a crucial role in figuring out what you can assume will be the result, for not just a standard investment, but also for an indexed universal life insurance policy designed for cash accumulation.
[responsive_video type='youtube' hide_related='0′ hide_logo='0′ hide_controls='0′ hide_title='0′ hide_fullscreen='0′ autoplay='0′]https://https://www.youtube.com/watch?v=cpYTkbW5FPw[/responsive_video]