

Indexed universal life insurance investment return on assets is an indicator we use to measure how well an insurer can maintain returns on its cash value products. Just like the whole life insurance investment return trend we published earlier this month, the same general principal applies (i.e. a higher return on assets held at the insurance company gives us indication that the insurer should be able to deliver a higher return on cash value products like cash accumulation focused life insurance products and annuities).
This time we’re looking at life insurance companies that are well known for their indexed universal life insurance offerings, and this time the results are a good bit different.
The General Trend is Mostly Flat
Unlike the whole life insurance focused carriers, the trend among the indexed universal life insurance focused carriers is mostly flat instead of negative. Whole life carriers have experienced a loss on average of 17 basis points on return per year for the last five years while indexed universal life carriers experienced a loss on average of just 2 basis points per year. This is interesting, though potentially explained by two primary variables.
First, there is the call option used for the indexing feature. However, this represents a tiny percentage of the overall insurer assets and the common practice among insurers is to exercise in-the-money calls once they have achieved a return that meets the index cap requirements (i.e. there’s generally not a lot of profit taking on calls as they are generally exercised or sold as soon as they achieve the desired interest rate cap return).
Additionally, since these carriers are rarely if ever engaged in the business of issuing participating insurance products and tend not to be mutual insurers, their capital requirements are less, affording them greater flexibility over spending/investing vs. saving decisions.
Also interesting is the shear number of insurers who have achieved positive growth in investment returns year over year despite falling interest rates. We know that this overwhelmingly not the case or whole life focused carriers. 10 of the 23 indexed universal life focused carriers evaluated achieved positive year-over-year growth in their investment returns whereas only one of the whole life focused carriers achieved positive year-over-year growth in investment return.
Methodology
Just like last time, we used a simple regression of the five year stated returns for each carrier as supplied by Ebix Vital Signs, which is data taken from statutory filings. There were 23 life insurers included in the analysis and we took an average for all 23 to evaluate the general trend.
Results For Indexed Universal Life Insurance Investment Return Trend
Here are the results of our analysis:
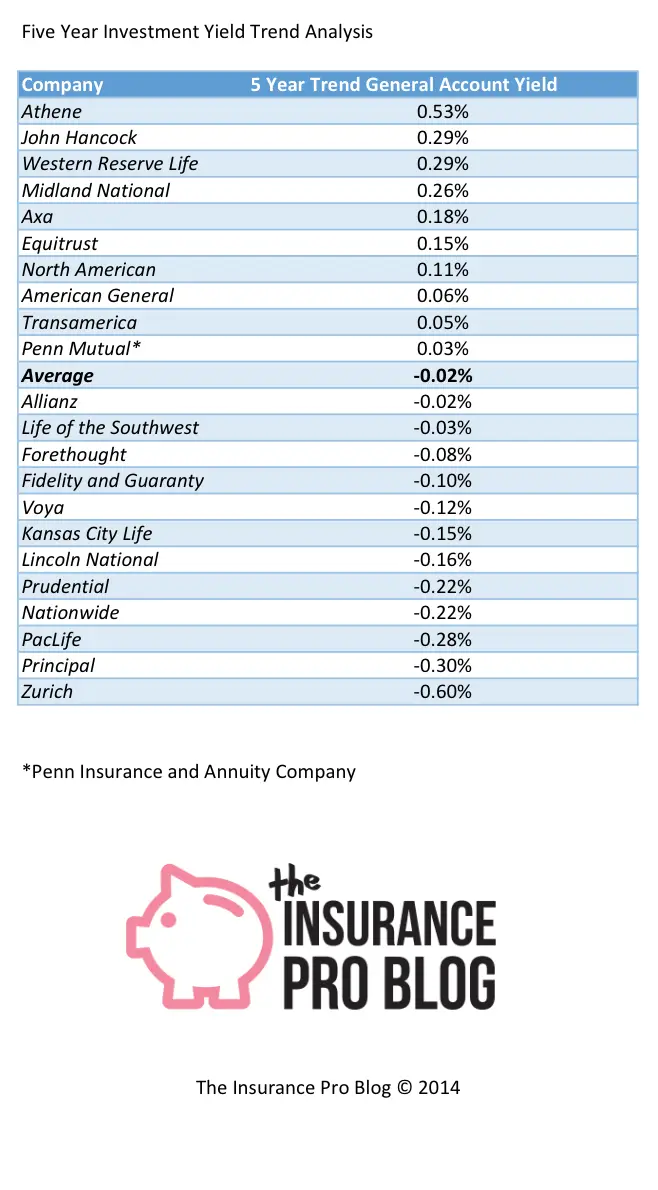
As noted above, 10 of the companies have achieved positive growth each year for the past five years. Also, seven of the 10 have achieved double-digit growth in return. The range among these carriers is much higher than it was with the whole life carriers as the top ranked and last ranked carrier each saw results in excess of a one-half of a percentage point in year-over-year growth/loss.
Like always, there are other Considerations
This is one of many metrics we use to evaluate companies. Growth or loss in investment return over a five-year period can be influenced by a number of factors that range from bad to inconsequential to good. Still it’s a useful metric in looking at overall health and vitality of an insurer.