

Podcast: Play in new window | Download
Since its inception, agents, marketing organizations, and even some general consumers have obsessed over the “average” interest credit assumed when projection indexed universal life insurance values. At one time, insurers used various “look back” periods–typically the one that showed their products in the best light–and regulators allowed these insurers to use whatever the average index credited interest rate from that look back was.
This created a scenario where many insurers assumed their static interest rate applied to cash value was something in the range of 7.75 to 8.5%. This seemed high, but due to other functional aspects of IUL, it also appeared to grossly overestimate how values might work out.
We had a situation on our hands that confused how “average” or arithmetic mean differed from the geometric mean. For years, investment sales and marketing organizations used this difference to lure in the less learned on the subject. What's funny is that many in the insurance industry cried foul while Wall Street played dumb about the differences and their significants. But, unfortunately, it appeared that with indexed universal life insurance, insurance marketers were just as willing to confuse the subject–especially when it benefited their story.
The Attempt to Reign in IUL Assumptions
During the mid 20 teens, regulators–at the behest of mostly whole life insurance-focused insurers–took on the issue of limiting IUL illustration creativity. We saw the widespread adoption of AG49 in 2015, and this began a long process of tempering indexed universal life insurance projections.
AG49 later took on even greater limitations that further subdued what someone can assume in an IUL projection. And, coincidentally, economic conditions forced cap rates–and other indexing features that affect the overall interest accumulation on cash value–down.
Today, we have IUL policies that might face restrictions regarding projected values that unrealistically subdue what the policy is actually capable of accomplishing. While I personally have no problem with under-selling the results of a life insurance policy's cash value accumulation. I do worry that this might lead people to make incorrect assumptions about indexed universal life insurance and its relative position in the market, among other savings options.
Because IUL comes with a slightly higher degree of “risk”–perhaps more appropriately labeled as variability–than a life insurance product like whole life insurance, it's understandable that one concludes IUL is only worth buying into if its returns are higher than whole life insurance. Of course, the degree to which it must be higher is subjective. But if illustration limitations are too aggressive in limiting the expected returns of an indexed universal life insurance policy, we might have a situation that allows “safer” assumed products like whole life to unfairly win favor.
Evaluating the Current Limitations on Indexed Universal Life Insurance Illustrations
We decided to look at a 50-year historical overlay of varying indexing options within one indexed universal life insurance policy and compare how those results look against current illustration practices. This is not the first time we've performed such an analysis. However, last time our concern was the exact opposite–that current practices might allow too optimistic an assumption. Therefore, we used three indexing options available from a specific indexed universal life insurance product currently available for purchase. Using these different options was important because:
- It gives us greater insight into how differing index features work.
- They all have a different maximum allowed index credit assumptions, and this allows us to look for a trend and test how well regulation controls for these variations.
- It gives us a chance to evaluate our own practice of assuming that–for the most part–all indexing features will produce roughly similar results.
The three indexing options used were as follows:
- Standard one-year point-to-point S&P500 indexing account. This account used an 8% cap rate and a 1% floor.
- One-year point-to-point S&P500 indexing account with enhanced cap rate. This account used a 10% cap rate with a 1% floor but also had an additional expense charged against the policy cash value.
- An uncapped S&P 500 index account with a 9% spread and a 1% floor. This means the index credit was the change in the S&P500 value index minus 9%. If this adjustment brought the credited interest rate below 1%, the floor was applied.
We also checked these results against a static 5.5% per year interest payment.
Here are the results:
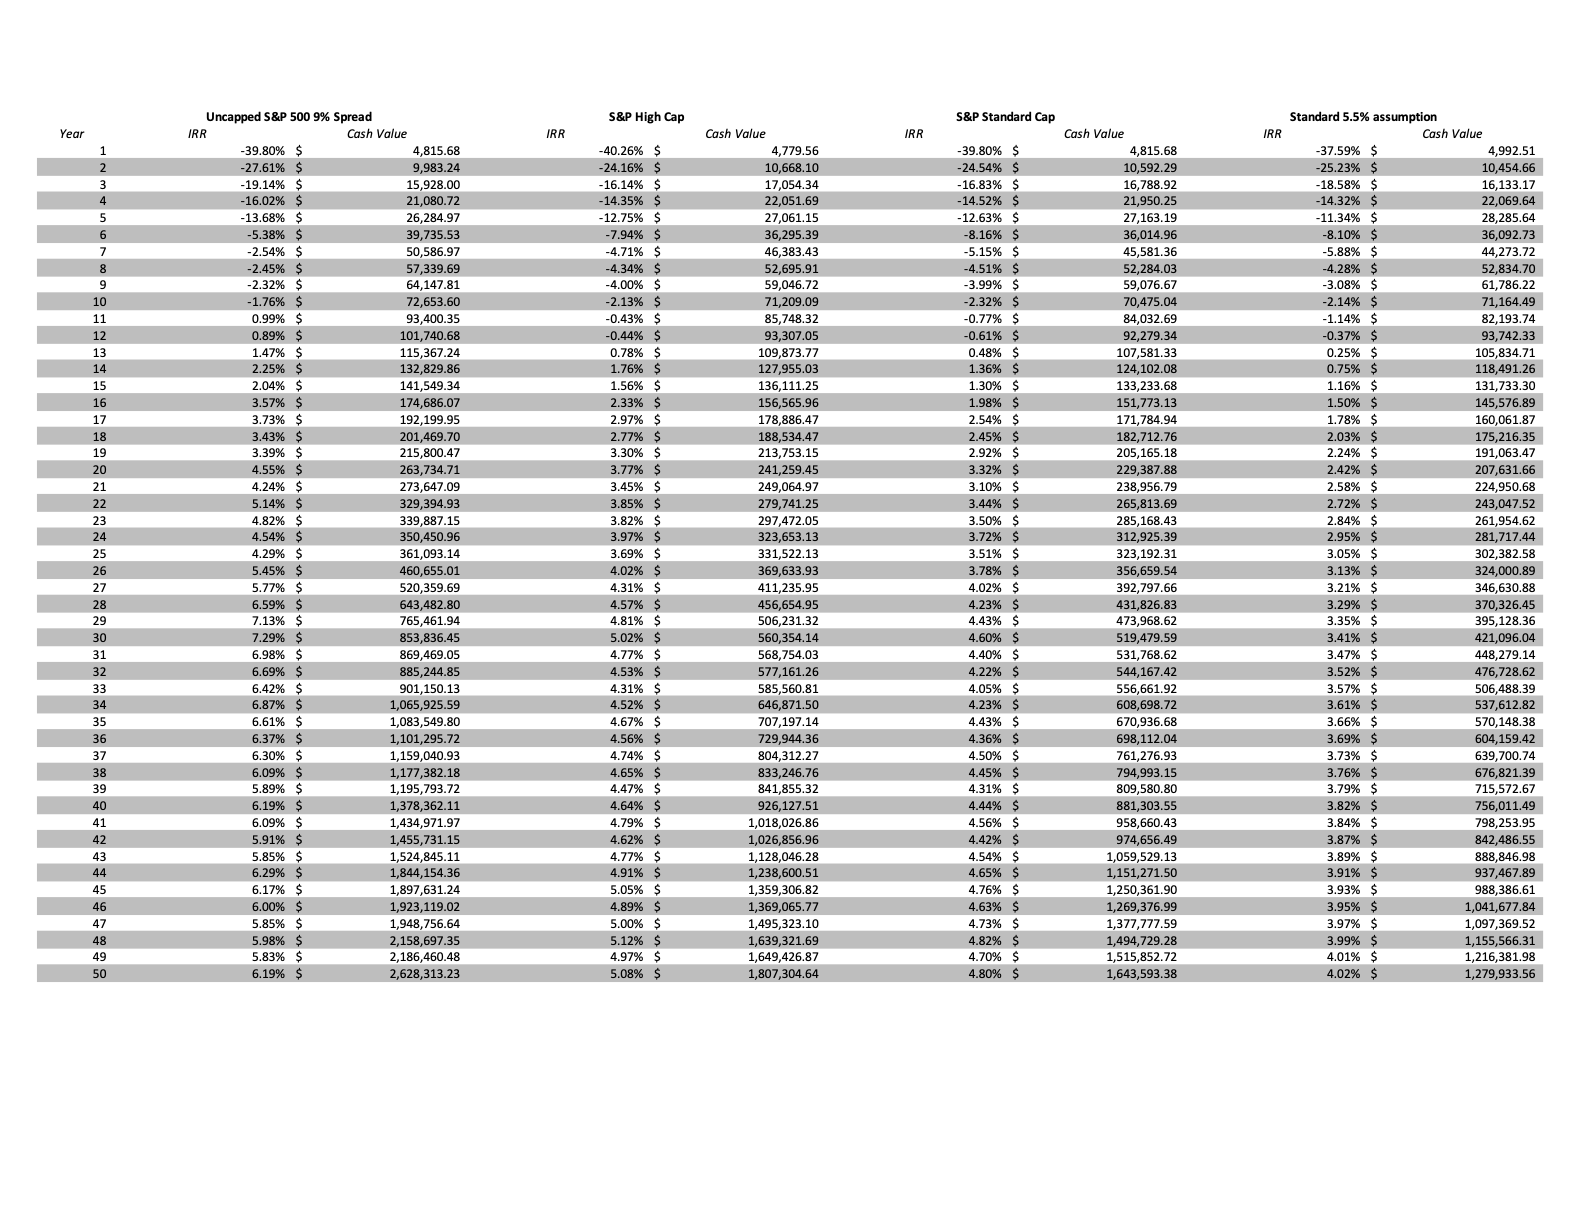
What I find most interesting about these results is the way the index accounts vary from their maximum allowed indexing credit. They are as follows:
- Standard one-year point to point: 5.46%
- Enhance (High) Cap one-year point-to-point: 6.18%
- Uncapped with 9% spread: 5.53%
Given these results, the uncapped indexing account should have the highest allowable interest rate, but it doesn't. This is most likely due to the “back-testing” methodology of the current regulation that focuses too much on the simple “average” index credit results. But for those interested, this is how those simple averages come out over this time period:
- Standard one-year point to point: 5.4%
- Enhance (High) Cap one-year point-to-point: 6.5%
- Uncapped with 9% spread: 6.9%
So evidently, there is yet more adjustment made otherwise the allowable maximum on the uncapped option is simply lower than it needs to be. Do note, I am aware that additional adjustments play a role based on the insurer's average general account returns.
How We Use Geometric Mean to Select Average Interest Rates Assumptions
When insurance marketers were assuming index credits around 8%, we were adamant about 6% being a much more realistic assumption. This wasn't based on any sort of back-testing for an average index credit, but instead was a number derived that closely tracked a target compound annual growth rate of cash value–effectively the same thing as the internal rate of return (IRR) we discuss it with insurance. This, we argued, was a much more accurate way of projecting IUL cash values; we still strongly believe this.
Notice from the table above that the static 5.5% IUL assumption has an internal rate of return lower than all of the indexing features. This happened even though current regulation–as interpreted from this specific insurance company–doesn't allow an assumption quite this high for the standard S&P500 point-to-point account. This happens because the timing of index credits and the fact that some years the cash value will grow at a rate higher than 5.5% matters.
In fact, to arrive at the same IRR from the standard point-to-point indexing option over the same time period, we have to use a static interest rate accumulation of approximately 6.3%.
While we do strongly believe that it's wise to subdue expectations with indexed universal life insurance, we also believe that it's possible to go too far with this product and any other strategy one might have for the future. The above analysis shows us that IUL has a good chance of producing higher returns than currently permitted for life insurance illustrations. While there are some reasonable arguments for this being a net positive. We think it's wise to strongly caution that this might be an over-correction from a time when assumptions were much too optimistic.