

Podcast: Play in new window | Download
The Whole Life Insurance Study began as a question concerning the impact modern communication technology had on the sale of life insurance–specifically whole life insurance. Given the freedom to publish content anywhere and everywhere with varying degrees of knowledge and expertise, the lines between true knowledge and conjecture blur a bit. As such, people develop opinions about the reality that guides their decision making. This adoption of ideals leads some to view certain subjects as more or less controversial than may actually be the case.
You don't have to look far to find differing opinions about whole life insurance. It is both great and terrible depending on whose web site or magazine you land on first. But these varying opinions are not new. Whole life insurance possessed diehard fans and diehard detractors for decades. While life insurance companies and sales agents obviously spoke highly of the product, competing services such as the A.L. Williams Life Insurance Company (now Primerica) and Waddell and Reed took up an opposing view many years ago.
Despite the success of A.L. Williams (in terms of his personal wealth accomplishments) and the later arrival of celebrity-like financial advice pundits (i.e. Suze Orman and Dave Ramsey), life insurance companies appeared to motor on profitably. Skip forward to now, and financial blogging becomes trendy among some with an occasional shot fired at whole life insurance in favor of buying term life insurance and investing the difference.
Today I'm not interested in discussing the merits of term and invest the difference or whole life insurance. I'm merely interested in the data that tells us if the wider availability of opinions (in both directions) affects the sale of life insurance–again specifically focusing on whole life insurance. So, I've gathered considerable data seeking to answer this question. The result of this data compilation and analysis is the Whole Life Insurance Study. The project morphed a bit beyond “are life insurers hurt or helped by various opinions about whole life insurance” and took on a role to check-in on the overall health of life insurers engaged in the issuance of whole life insurance.
Methodology for the Whole Life Study
The easiest and most accurate source of data for this project is in accounting statements prepared by life insurers. Life insurers must prepare accounting statements for state regulatory purposes that detail the company's capital positions as well as business operations. These statements are audited by third parties. This gives us a great view of the insurers accumulation of assets, success or failure in generating income with those assets, management of liabilities, and overall business operations.
Within this data, we can answers questions like:
- How many policies does the life insurer issue in a year?
- How much money does the life insurer make on life insurance policies?
- How much income does the life insurer create from the assets it manages?
- How well does the life insurer generate income as a function of its business operations?
- Is the life insurer profitable?
If we look at this data statically, we might draw inaccurate conclusions about the overall success or failure of an individual company or the entire industry. Instead, if we look at this data and how it changes over time, we get a better feel for how life insurance companies handle all business operations and get a sense of overall success or failure.
For the Whole Life Insurance Study, we used accounting data spanning the past five most recently available years. The exact timeframe is 2014 through 2018 (we're in the process of compiling all of the data for 2019 and will update this study next year with those results).
We specifically focused on operational data. In other words, we looked at data points like:
- Number of policies issued
- Average policy size
- Profits earned on life insurance as well as overall
- Dividends paid
We then calculated the average annual change in these data points to get a sense of the overall trend achieved by life insurers.
Because our focus is on whole life insurance for this study, our sample size used only insurers identified for a focus on issuing participating (i.e. dividend-paying) whole life insurance. We identified eight insurers for the study and used their accounting data to complete the study.
What follows is an aggregate capitulation on the data points analyzed, but if you are interested in more granular details, we are making it available.
Simply click here to get access to company-specific data, as well as calculated trend data for each company.
Total Number of Whole Life Insurance Policies Issued
One of the very first data points of interest was the number of policies issued by life insurers. If the consensus among American life insurance consumers is negative towards whole life insurance, we'd anticipate a decline in the number of policies issued over the time period. While the data we have did not parse specifically whole life insurance sales, our selection of life insurers in the sample size ensured that the majority of life insurance policies issued are whole life insurance.

In 2018, the eight life insurers in the sample size issued a combined 857,627 life insurance policies. The year-over-year trend for the five year period shows a 2.20% growth per year. This is certainly a positive trend for these life insurers. Some insurers had more success with this than others, but almost all experienced positive growth. Only one insurer in the group had an overall negative trend for the five year period.
Click Here to Download the Company Specific Data
Average Policy Size
In addition to the total number of policies issued, we wanted to know if people are buying more or less life insurance in the same time period. Looking at the average policy issued for each year, we can easily answer this question. Similarly to the total number of policies issued, if the overall opinion of whole life insurance is negative, we'd anticipate a negative trend for this data.

In 2018, the average policy issued by the companies in the sample was $596,738.13. According to data pulled from Ebix, that's 249% larger than the average policy issued across all life insurers in the same year.
There is a considerable spread across the sample companies. The largest average policy size in 2018 was nearly $1 million while the smallest average was slightly under $300 thousand. All of the life insurers included in the sample experienced an increase in year-over-year growth of average policy size.
Individual Life Insurance Profitability
Looking at the profitability of individual life insurance policies, we see results that vary considerably. While the overall average trend is positive, and positive by double digits. This result is overstated by large swings in the overall profitability of the product line.

Four of the eight life insurers in the sample experienced an overall negative trend during the five year period. Three of those insurers had several years where individual life insurance profitability was negative.
The other four insurers maintained a generally positive trend on individual life insurance profitability, but still, some had a year that resulted in negative profitability.
This data is not exclusive to whole life insurance, but given the large portion of sales comprised of whole life insurance at the sample companies, we know it's the primary product category within the individual life insurance line for the majority of the sample group.
Why such variability in the profitability of the individual life insurance line? This is the most likely function of acquisition cost. When an insurer experiences increases in new life insurance sales, the expenses associated with obtaining that business are often larger than the premiums collected for a few years. Insurers often amortize this expense using various accounting options, so the overall profits recognized by the line of business faces adjustments not just for business conducted in a given year, but also for past amortization decisions.
Cash Flow from Operations
Despite the choppy profitability on individual life insurance, almost all companies operated profitably in all years and most achieved year-over-year growth in operating cash flow. Operational cash flow for insurance accounting is profits recognized before policyholder dividends, taxes, and realized capital gains.

Overall the average year-over-year growth for the sample group was a positive 2.91% per year. This figure is theoretically the pot of money life insurers have to pay dividends to policyholders. While some insurers do–from time to time–use other reserves to pay a higher dividend than operating cash flow, we generally see the dividend payment as some number lower than operating cash flow.
Five of the insurers in the sample had a negative trend in operational cash flow over the five year period. One insurer experienced an operational loss in one year, which happened to be 2018 for that specific life insurer.
Two of the three insurers with a positive year-over-year trend achieved considerable growth. Two of the insurers with a negative year-over-year trend had a nearly flat growth trend, while three experienced a considerable (double-digit) year-over-year decline in operating cash flow.
Revenue Per Dollar of Expense
There are many ways to look at how a business manages expenses. Within the life insurance industry, a lot of people like to discuss it in terms of percentages of revenue or premiums. We prefer looking at an insurer's ability to produce income relative to the expenses it incurs. We calculated the dollar created by each insurer per dollar spent on regular operations (including sales commissions). This allows us to evaluate two things. First, it shows us if operating the company is absolutely more or less expensive year-over-year. Second, it shows us how much money a life insurance company can generate with every dollar it uses on business operations.
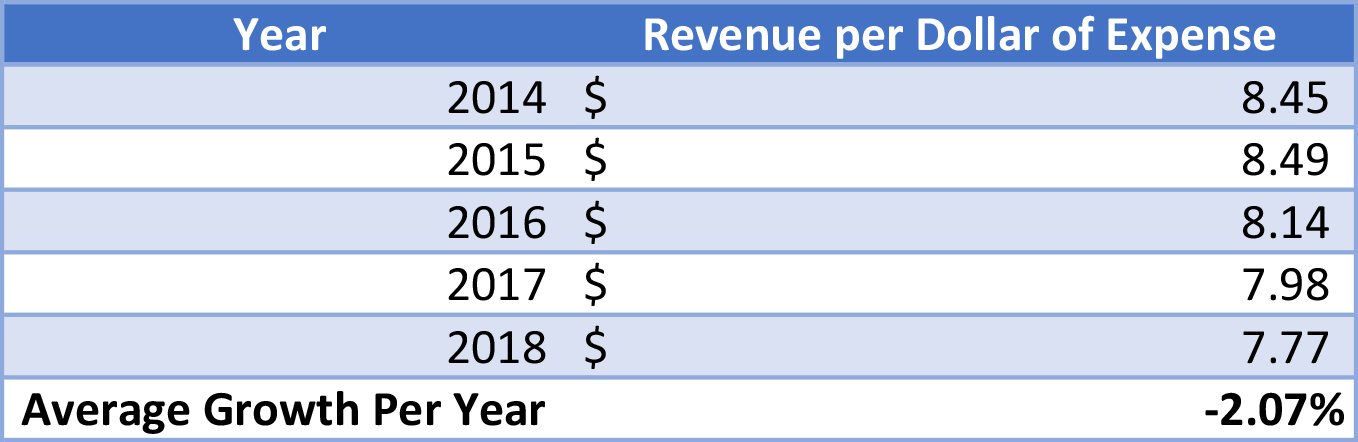
The average year-over-year change is negative 2.07%. This means life insurers made a little less year-over-year per each dollar spent during the past five years. The ability to create $7.77 in revenue for ever $1 spent transacting business is certainly admirable. Many major businesses in other sectors perform far worse and achieve praise for their ability to create income.
This does suggest, however, that the general trend is a higher expense to operate each year. Most of these life insurers achieved revenue figures that increased year-over-year, but expenses also increased and they did so at a faster rate.
There is, however, some additional consideration about this data point that is well worth noting. Several insurers started out considerably higher than the 2018 average and remained above it. Two insurers, in particular, had double-digit results that declined over five years but remained well above the average $7.77 of the sample group. So while the negative trend is certainly less favorable, it's hard to tell how worrying this trend is.
Net Investment Income
Investment income is a huge driver of whole life dividend performance. For decades, investment income–particularly in excess of contract guarantees–held the greatest influence on life insurer profitability. We published several posts on this subject and analyzed it quite extensively in the past.

The sample group achieved an average year-over-year growth of net investment income of 6.31%. These results are decent, but they do show considerable slowing of growth compared to prior results achieved. Given the role investment income plays in overall life insurers profitability, we start to gain clarity on how this sample group could achieve positive policy count sales growth, positive death benefit size growth, and yet still have fluctuating cash flow and rising operational costs (see more about this in the Conclusions section).
There was very little variability concerning this datapoint across the sample group. Most insurers were close to the average, with one exception (life insurers that had a very slightly negative result during the time period).
Average Contract Liability
Looking at investment income is only one piece of a larger puzzle concerning life insurer profitable operations. We also have to look at contract obligations and how they grow over time. Functionally, life insurers seek to create returns on the assets accumulated through premium payments to cover the guaranteed features promised to policyholders. We can quantify these promises by looking at the insurer's accounting statements and tallying the liability created by them.

While these obligations remain much smaller than net investment income in all years, they are growing at a faster rate than net investment income. This is not a great trend for these companies. It's important to note that this trend is highly unlikely a result of an overall negative consensus towards whole life insurance. In fact, if that where the case, we'd anticipate a declining policyholder obligation as people surrendered their life insurance policies. Instead, we see a positive year-over-year result, which is fine and expected if policyholders keep their insurance policies.
The problem for insurers is the way these obligations grow in relationship to investment income. Declining interest rates squeeze the margin between obligations and investment income, which in turn makes insurer profitability decline.
However, not all life insurers in the sample group face the same reality. Two life insurers grew net investment income at a pace larger than contract obligations. A few others grew investment income at a rate very similar to liabilities. Some, however, did experience a much faster-growing policyholder obligation than net investment income growth.
Policyholder Dividends
Many people closely associate whole life insurance with dividends. Dividends play a crucial role in providing policyholder value to owners of participating whole life insurance. It only makes sense that we would evaluate the change in dividend payments throughout the five year period.

In 2018, the eight life insurers included in the sample paid a combined $10.5 billion in dividends to their policyholders. Dividend payments increased on average across all insurers in the group by 2.11% per year.
Dividend payments are a serious business among these life insurers, and they all show no signs of wavering when it comes to delivering on that task. Seven of the eight had positive year-over-year growth in dividend payments. The one exception is a life insurer that has changed its focus in recent years somewhat away from whole life insurance (see the downloadable appendices and deeper dive for more information).
Conclusions
We are aware of no other source that analyzed sales and operational data for whole life insurers to this degree. Our intention with this analysis began as a question to evaluate how the general consumer views whole life insurance by voting with their wallets. It evolved to additionally evaluate the overall health of the companies heavily engaged in manufacturing and managing whole life insurance policies.
What we find from the data is a tale suggesting people are much more favorable towards whole life insurance than some media sources suggest. Policies sales show no dramatic decline and the insurers who focus on whole life insurance appear to sell more and more life insurance each year.
But the expense of being in business is increasing. Life insurers are competing in crowded advertising space and ever-growing alternatives with respect to savings options.
The biggest struggle appears to be investment returns on assets and not a wholesale negative opinion of the industry or the product. The data suggest people are buying the products and keeping them.
The data also shows that some life insurers succeed more than others. While the overall trend is mostly positive, some life insurers fall below the general trend while others fall comfortably ahead of it.
Awesome research! It’s great to have financial number geeks to listen to. Makes me feel like there are other who actually care about the industry, the operational and mechanical nature of their profession and not just the selling of the end product. I’m a series 7,66 licensed broker or agent (whatever) and I find the insurance side a far more interesting and while it’s not perfect, it’s far simpler to apply and implement in plans due to the predictability. The investment side really made it hard to sleep at night…. even when making all those nice spread sheets… no one cares for all the prep you do when the the market falls and their account value is shot. No one cares that the they signed a form saying they understand the risks blah blah blah. Anyway, I’ve binge listened. And will continue to.
Solid post. I think there are some refinements needed though. For example, the policy counts are generally inclusive of term but some of the companies listed sell a significant amount of term by count. This also impacts the average policy size section of the report, albeit directionally. Additionally, there isn’t a great proxy for cash flow in stat accounting so you may consider adding additional context to that section. Good work on asset/liability view. Reach out to me if you would like to discuss.