

Podcast: Play in new window | Download
Whole life insurance works well as a retirement income tool because it offers a very stable year-over-year return. This feature minimizes the effects of sequence-of-returns risk that causes other assets to (at times) turn fewer saved dollars into income because it needs a bigger cushion to protect against potential asset declines.
But how strong is whole life insurance in this regard? We set out to evaluate this notion and put a figure on the relative strength whole life insurance has when compared to a general stock portfolio. We enlisted a tool of the enemy with Vanguard's retirement income calculator. I like this tool for this purpose because it allows us to compute the compound annual growth rate of return we need to achieve to produce identical results to the whole life policy. I think you'll find the results of this analysis eye-opening.
Evaluating Whole Life Insurance and Stock Portfolio Retirement Income Projections
We started with a standard (for us at least) whole life policy that maximizes cash value through policy blending and maximum paid-up additions allowance. We compared these results to Vanguard's retirement income calculator. The calculator at Vanguard allows us to plug in an annual savings amount, specify the number of years we plan to save, and identify an assumed rate of return. With that information, the Calculator will produce the projected retirement income we might expect from such an investment.
The Calculator reports other things, but they aren't applicable to this analysis, so I'll skip discussing them in today's blog post.
Using the Calculator, we can figure out what sort of rate of return we need in the stock portfolio to match the whole life policy. But I need to address a few important notes about this calculator.
First, it does not assume any adjustments for fees. Second, it makes no adjustments for assumed taxes payable upon the liquidation of funds for the purpose of creating income. So the Calculator's reported figures throughout this analysis are gross figures, which could be net figures in some unique circumstances, but most likely are not.
I'm running this analysis assuming a male age 40, who plans to retire at 66. He's saving $25,000 per year in this scenario.
Current Whole Life Dividend Rate Compared to Market Investment
Running the whole life proposal, we get the following results:
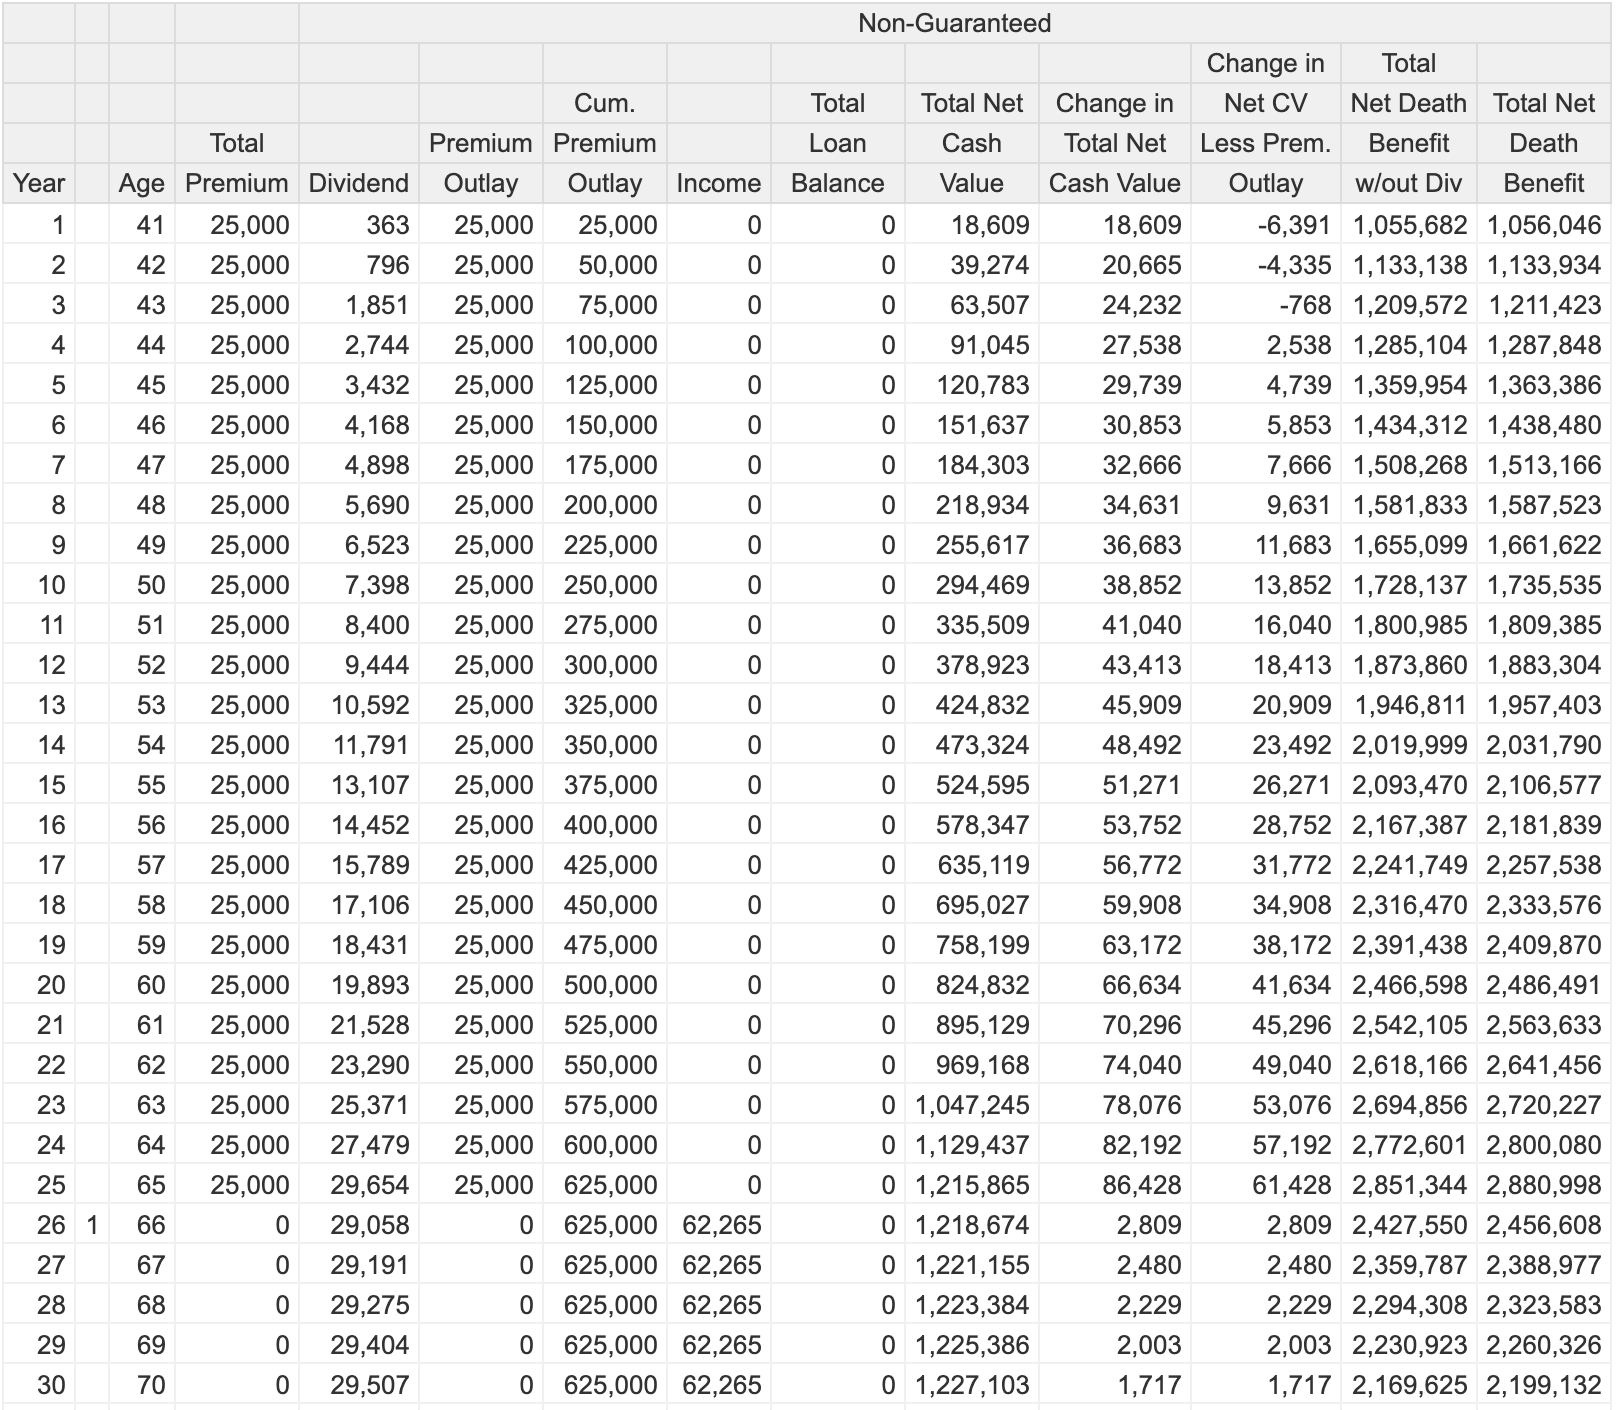
There are a lot of numbers here, but the important ones to note are that we correctly assumed 25 annual payments of $25,000. The whole life projection tells us that we can then use the cash value accumulated in the policy starting at age 66 to produce $62,265 in retirement income per year. We can do that through the policy owner's age 100 (not shown in the ledger, but that's how I set up the projection).
Using the Vanguard Calculator, and targeting that same $62,265 per year retirement income, our hypothetical saver reportedly needs to achieve an annualized year rate of return of 9.1%. Here is the output from the calculator:
 Vanguard's Calculator reports the retirement income figures as monthly amounts, so we simply need to multiply that figure by 12. This produces an income figure slightly below the whole life annualized amount, but sliding the assumed rate of return to 9.2% per year produces an income figure further away from the whole life number, so I'm rounding and calling it at 9.1%.
Whole Life with Reduced Dividend Scale
The savvier financial bloggers who detest whole life insurance will quickly rush in and note that those projections are merely projections based on a currently assumed dividend rate that may not materialize throughout the next 25+ years. I agree with the sentiment, so I looked at this same scenario using a 100 basis point reduction in the dividend. Here's what making the reduction in the dividend produces for results:
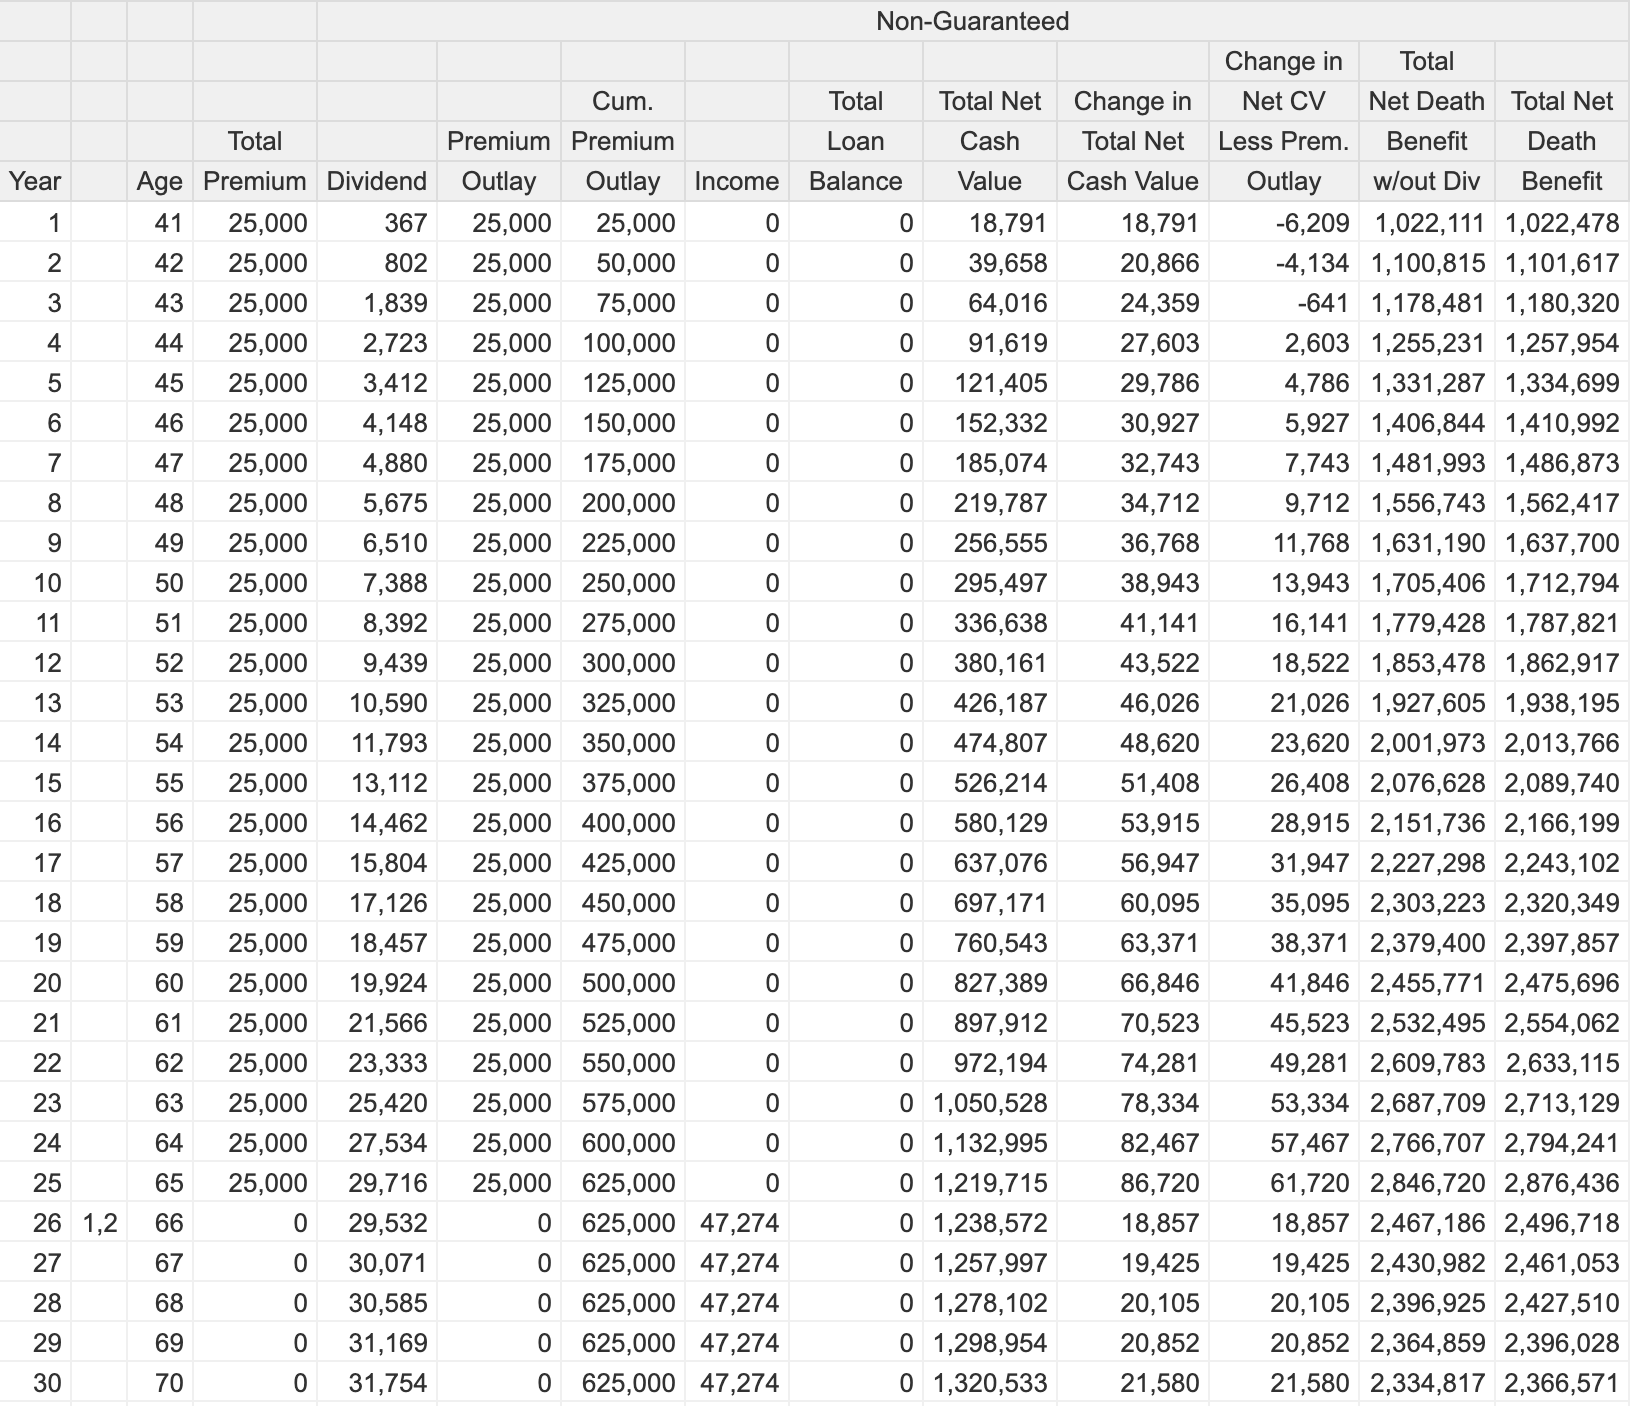
Our income figure drops to $47,274 per year. Certainly significant, and now we need to adjust the rate of return assumptions using the Vanguard Calculator to determine how this compares to stock market investing. Here are the results of that:
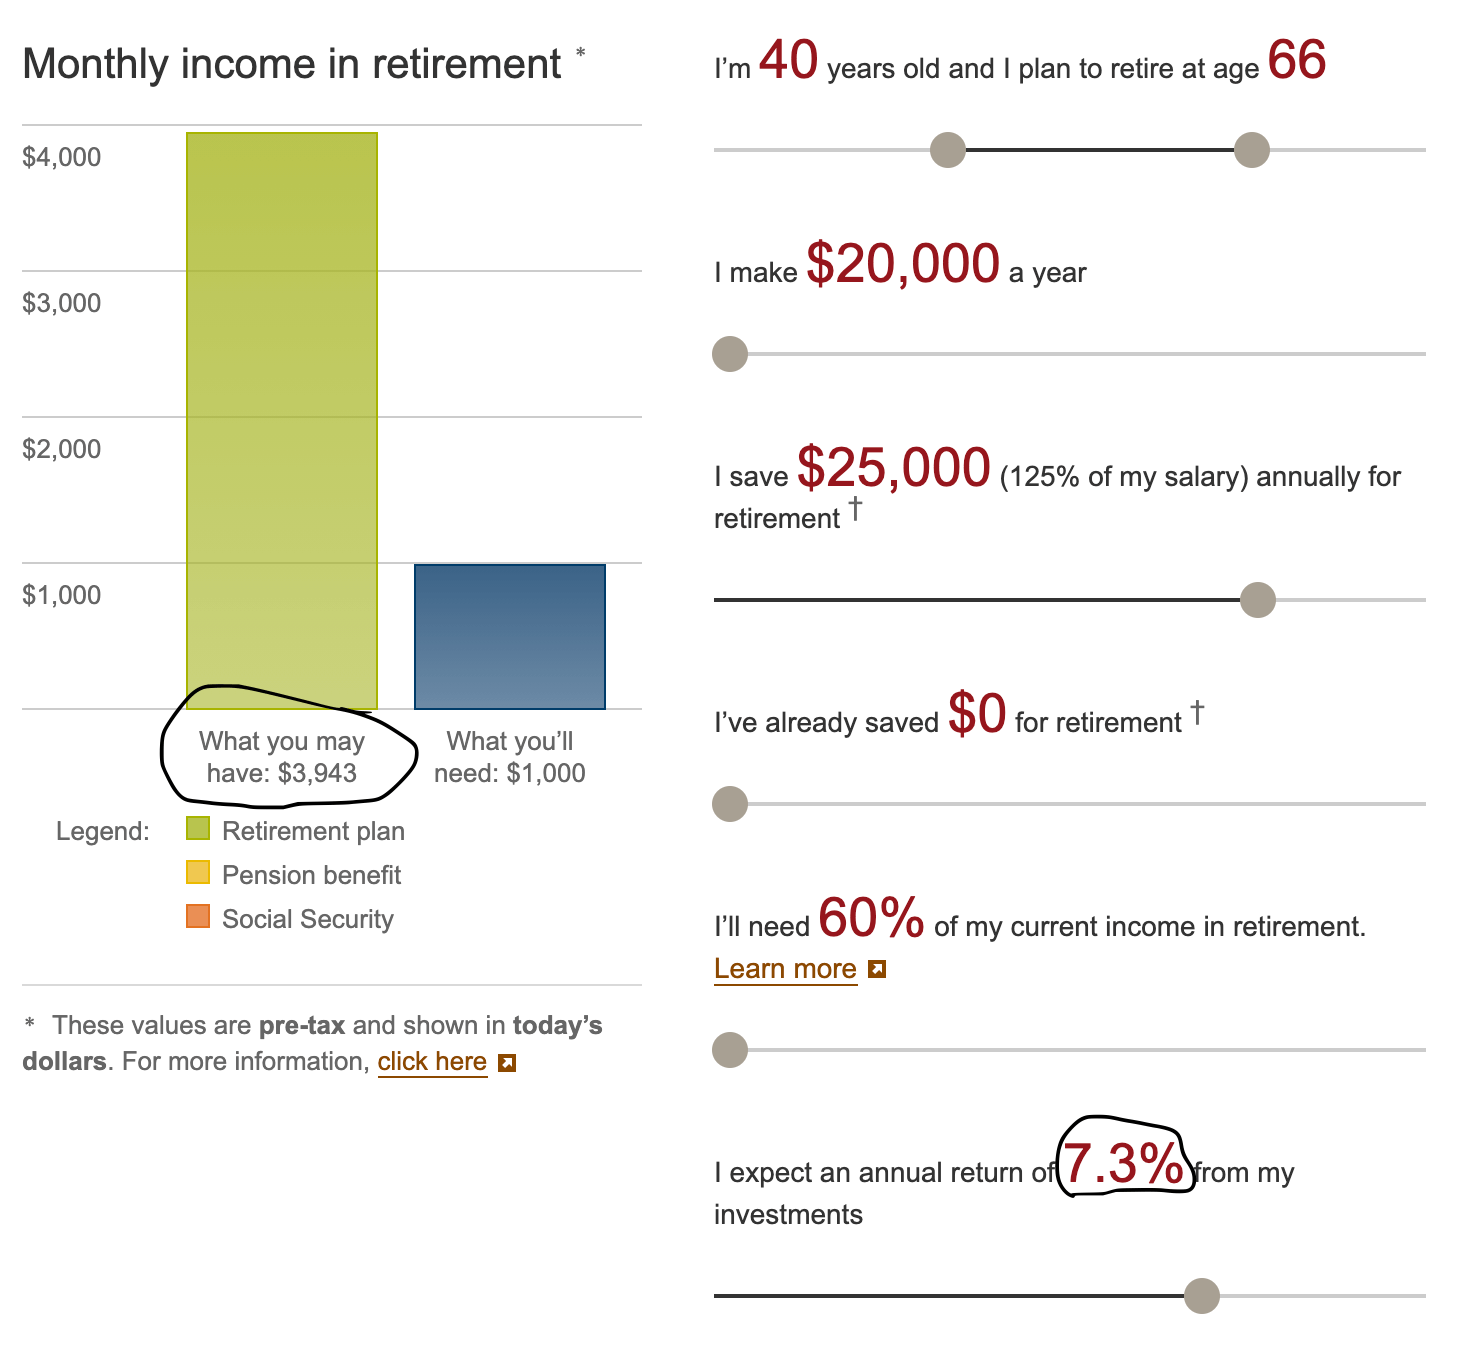 Our hypothetical saver needs a 7.3% annually compounding rate of return to match the whole life policy with a 100 basis point reduction in the dividend from the current level.
Zero Dividend Whole Life Compared
There are some who suggest the only way to truly make a meaningful evaluation on whole life insurance is to look at it with no dividends. This is because it's the only way to figure out what the policy guarantees. While that's an odd statement juxtaposed against a recommendation to buy stocks (I'll let you figure out the irony without explicitly pointing it out), I figured why not?
So to leave no stone, no matter how unlikely, unturned here's the zero dividend scenario:
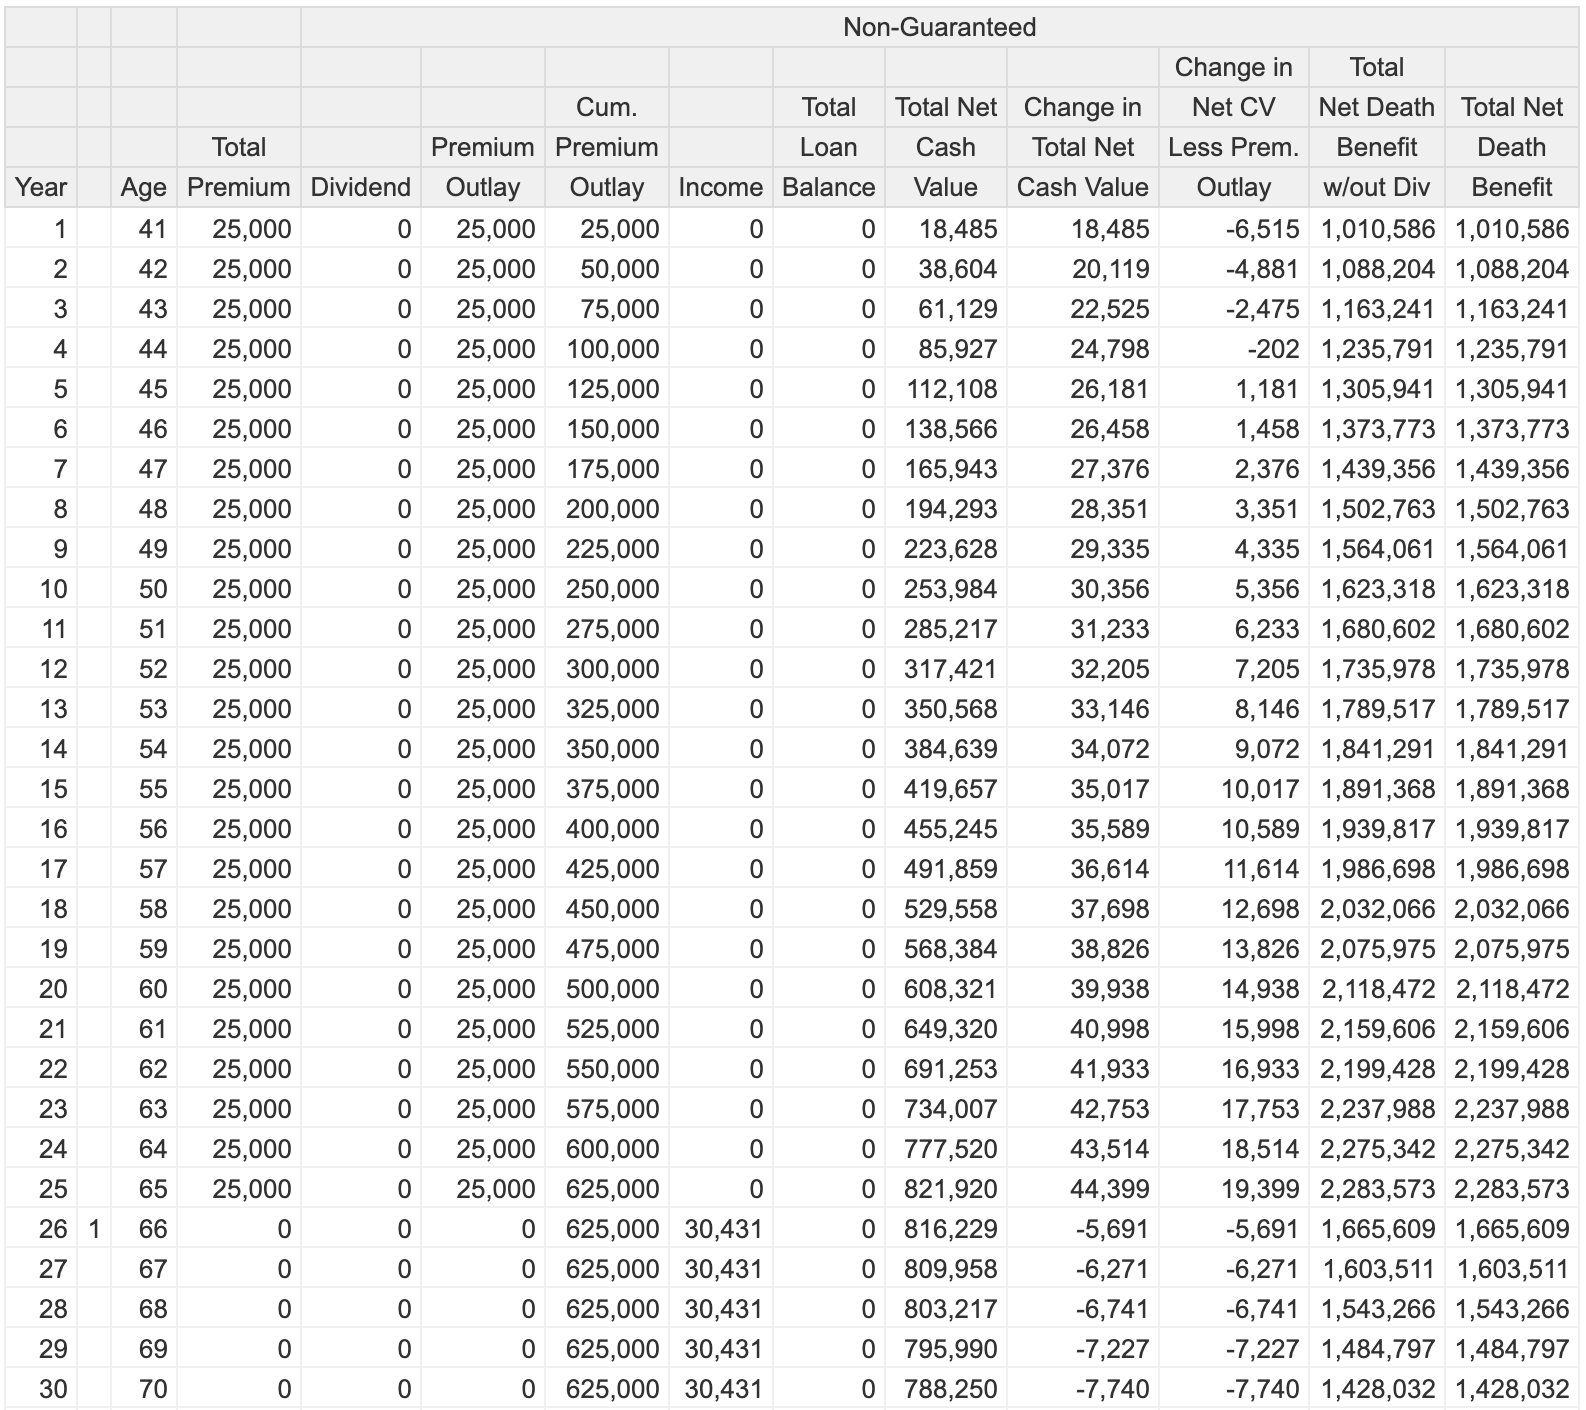
Income figure drops (no surprisingly) again, but how does this compare to the stock alternative according to the Calculator? Here's the result:
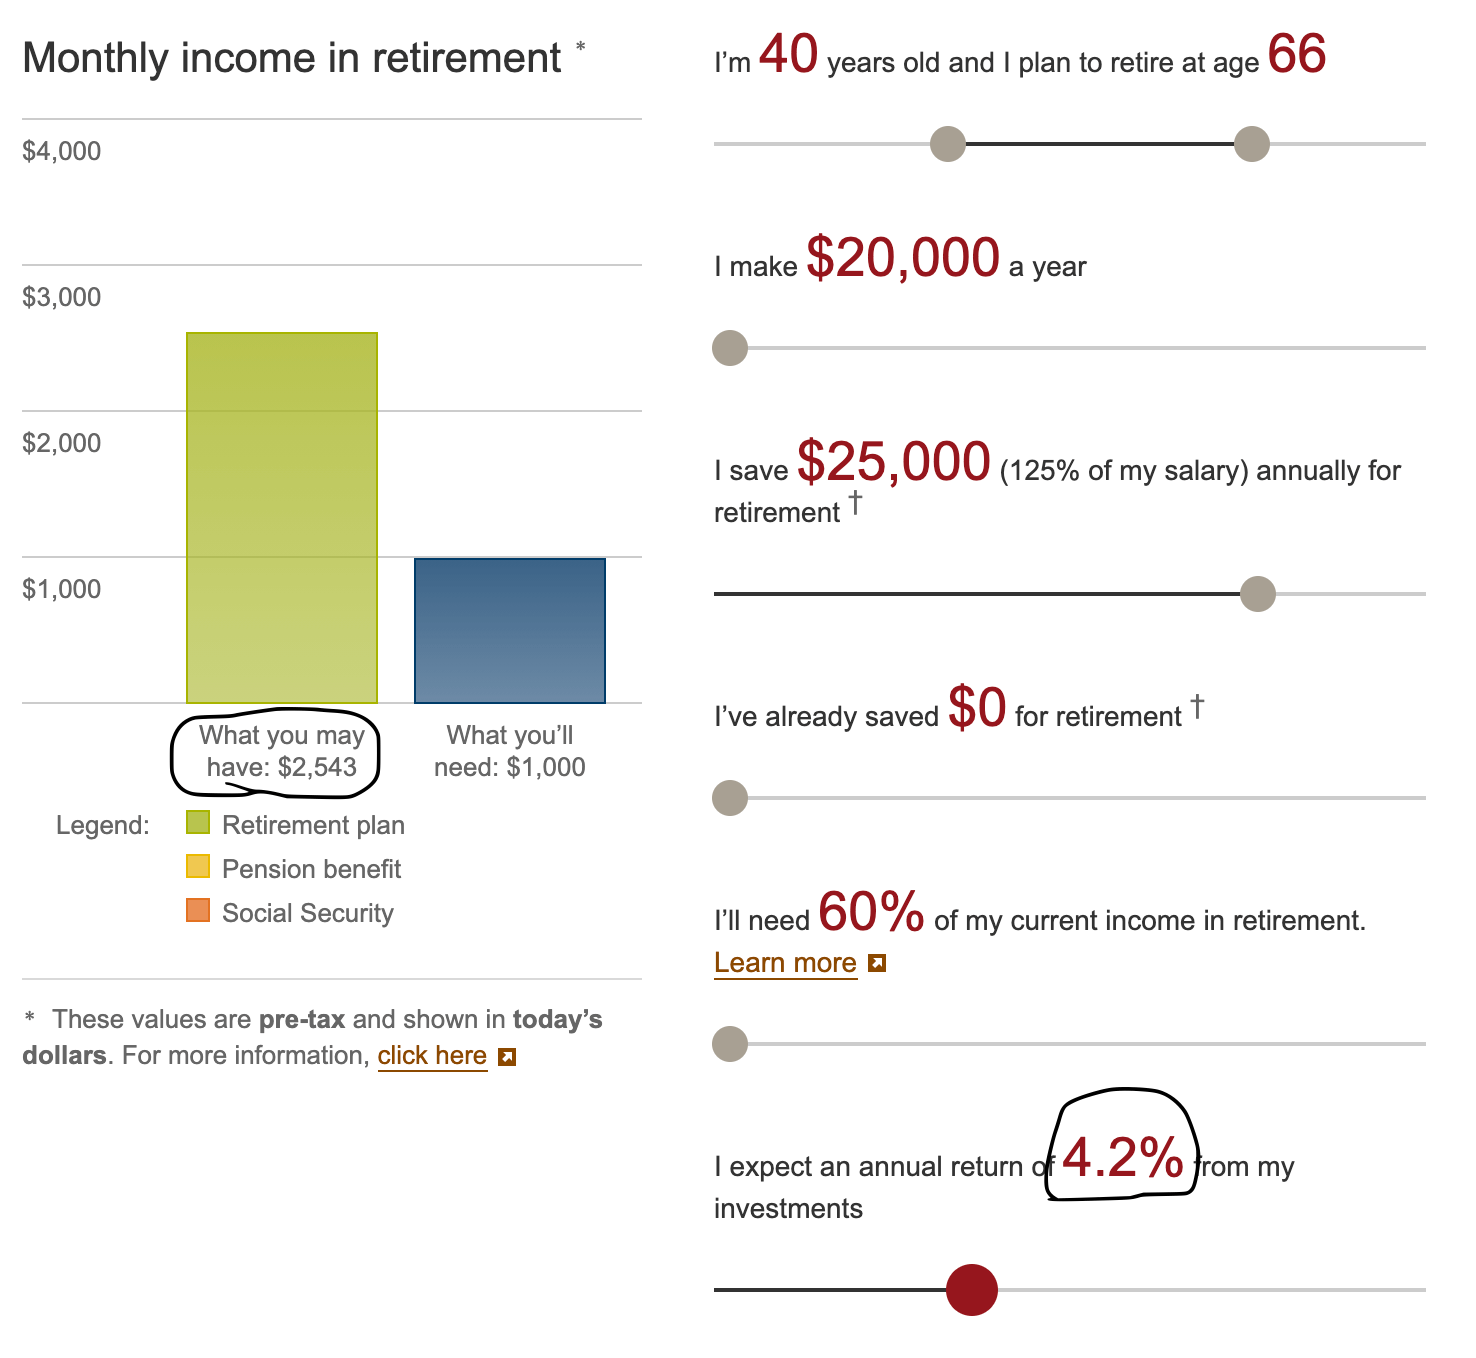
Our hypothetical saver needs a 4.2% annualized return on his investments to match the whole life guaranteed results.
Observations about these Results
I'm quite stunned by the rate of return needed to match the current whole life projections. We noted something similar to this result years ago when showing that the functionality of whole life made it very strong as a retirement income tool. Simply put, whole life insurance provides a lot of retirement bang for your investment buck. While some people choose to argue over the nominal rate of return and who has the biggest balance of cash at the end of seemingly arbitrary years, I always thought it wise to look at the absolute value one could extract from a given pursuit. This is why I have a favorable view of whole life insurance.
Keep in mind that the odds of actually achieving a 9.1% annualized return on a systematic investment over any time period of 10 years or more is incredibly low.
I'm equally stunned by the required rate of return needed to match the projections of the 100 basis point reduction. While we agents often look at dividend reductions as terrible things, we often overlook the fact that there are a lot of whole life policies out there that still…despite the year-after-year announcements of dividend reductions…still compare extremely favorably against competing savings options. Whole life doesn't live in a vacuum, and the economic conditions that cause it to decline or enhance in value have some impact on other asset classes as well.
I find the guaranteed results perhaps the most interesting. In truth, I almost didn't even bother with the part of the analysis. It seemed pointless given the extremely low probability of such an event unfolding. But looking at the required rate of return to match the results, I'm shocked at what whole life pulls off in this case. Keep in mind, this what whole life insurance is guaranteeing.
Sure most people reasonably expect a rate of return in the stock market higher than 4.2%. I believe I can achieve something higher than that long term with my stock investments. But we shouldn't forget that DALBAR continuously shows us year-over-year that most people fall very close to this result with equity-focused mutual funds. And again…let's not forget that the whole life numbers for this scenario are guaranteed. There's no guessing, hoping, or overcoming the anxiety of opening your latest statement.
Bottom Line
Whole life insurance produces incredible value for its policy owners. Rate of return is an often quoted and more often misunderstood vanity statistic that investment salespeople and some (probably well-intentioned) bloggers use to try and argue against life insurance. But unless or until those same people come to you with a solid plan that shows exactly what they intend for you to do with that rate of return in stocks, you have reasonableness to be wary of their claim. After all, you cannot buy groceries with rate of return all on its own.
Excellent analysis I shared on my social media. This analysis doesn’t even take into account the value of the insurance itself which has tremendous merit!!
Thanks Matt, and good point about the additional value of the life insurance.
While I appreciate your analysis, and I am generally aligned with your perspective regarding the value of whole life, I feel that in order to really do this blog post some justice, you need to identify at a minimum, the carrier, and specific product details used for this analysis. Otherwise one could simply argue that you made up the results to fit your claim.
Hi Bryan, if you have any experience with various life insurance carriers that issue whole life insurance and their illustration software, you’d know exactly what company I used to do this given the screenshots of the value outputs.
When income is taken from age 66-100, is it withdraw to basis first & then policy loans? Is the policy loan interest not due until the death benefit payout?
Hi Rick, correct. The whole life income is withdrawal to basis and then loans to keep the distribution tax free. We assume the loan will remain until death of the insured of the policy.
Is income from Vanguard being disbursed from principal and interest after the return like the income from the Whole Life policy?
Yes it is.
While I always knew (thanks to your extremely educational web site) that Participating Whole Life is an unbeatable investment for retirement planning etc., THIS illustration blows my mind! I have passed it on to my closest friends. Sadly, I wish I had come across your site and illustrations about 30 years ago – I would have invested differently and come up spades all around. Unfortunately my diabetes and other conditions make any kind of insurance prohibitive at my age. Thanks for the clear illustration!
The Vanguard retirement calculator tells us:
“This is the retirement income that your current retirement plan will provide. To calculate it, we first determine how much you’ll have saved by the time you reach retirement (your “nest egg”). Then, we use the “4% rule” — that is, we assume that you can afford to spend approximately 4% of your initial nest egg each year in retirement and be reasonably confident that you won’t outlive your savings. The result is adjusted for inflation (3% annually).”
How did you account for this discrepancy between the policy’s illustration and V-guard’s calculator?
We chose to let the fact that we did not introduce an adjustment for fees or taxes on the investment credit against the inflation adjustment factor for Vanguard’s calculator. It’s not a perfect system, but nothing ever is.
Something flawed in your logic / analysis I think. If one invested $25k for 25 yrs compounding at 9.2% you’d have $2.2M in cash. Yes presumably a taxable amount. If you assume 5% return (not unreasonable) when you start withdrawing for the next 34 years you could pull out about $134k/yr
Hi Cameron, I think you’re assuming a static 5% annualized return in your distribution phase. The problem here is that a market-backed portfolio will not produce this sort of result. The variance from year-to-year will dramatically impact the actual amount that you take from the asset pool over a 34 year period of withdrawals. Good market results early on could provide even more income than you reported. Bad results can dramatically reduce this figure.
If the 625,000 of total contributions had been made over 5-7 years (age 41- 45 or 47) instead of 25 years & then left alone until age 66, how much of an effect would that have on the distributions from age 66-100?
It would increase the distributions as all of the money would be in the policy under a shorter period of time and benefit from the growth features of the policy.
Thanks for this breakdown. I am still learning a lot about how the whole life policies work. I do have a question about the Total Net Cash Value column. I realize that the premium + dividend at some % less than 100 is the calculation for this. However, on the last chart, at year 10, the Total Net Cash Value is greater than the Cumulative Premium Outlay. How could this be is not dividend is payed? The Net Value of an account should never be greater than the Premium Outlay from my perspective. What am I missing?
Hi Blake, whole life cash values (regardless of source) earn guaranteed interest. This can certainly create a positive return on cash value versus premiums paid and it’s exactly why you would achieve a net positive as reported in the ledger.
Hey Brandon
Thanks for providing this article and taking the time to do this research.
I have a couple questions.
The first is when you run the illustration with a 100 basis point reduction the illustration with the assumed lower dividend has more money from start to finish and similar or larger dividends. Can you explain this?
The second question I have is does the vangard account assume that all the money is being drained by age 100? Or is the account assuming that you accumulate enough to just live off the interest earnings created by the investments? I think you may have commented on this in the questions already but I wasn’t quite sure still after reading the response.
Hey Jason,
The lower dividend scenario assumes we knew that lower dividend in all years and allows for a lower death benefit per MEC regulation so we actually get a slightly tighter allowance in net amount at risk under this assumption. It does provide a small boost (vert small) to cash value in earlier years, but it does fall behind in later years. This is why the income projection is so much lower.
The Vanguard calculator is assuming an income that should last through one’s life expectancy. It’s not necessarily assuming a zero balance at age 100. This zero balance could come sooner and still satisfy the requirements for success under the calculator’s assumptions.