

Podcast: Play in new window | Download
If you are looking to buy whole life insurance, you've likely spent more hours than you'd care to admit tootling around the internet looking for tips on what makes for a good whole life policy. And thanks to the modern wonders of easy website development and content creation, your appetite for information has likely been fulfilled. Within the past handful or so of years, several newly minted insurance agents have sprung up sites, YouTube Channels, and Tick Tock…whatever they're called on Tick Tock…to profess their expertise in whole life insurance and provide you with “advice” on how to go about selecting a good policy.
A more common suggestion–with stunning controversy–is the so-called 90/10 split design. Here, advocates claim that a policy whose premiums comprise 90% paid-up additions and 10% regular whole life insurance is the ideal design that will bring you all the riches you could ever hope to achieve from owning a whole life insurance contract.
Being the guy who founded and now co-owns and co-operates the oldest website focused on highlighting the uses of cash value life insurance for financial planning purposes–and being an extremely early voice supporting the idea that more paid-up additions in your whole life is generally a good idea–you'd think I'd emphatically bless this 90/10 thing. But to assume that I'd arbitrarily latch on to a theoretical idea and voraciously advocate for it without first putting it through its paces shows you don't know me at all, internet. Oh and there's also that other thing we often say around here…it depends.
So for those of you who seek an easy-to-follow rule that offers absolute and incontrovertible truth…I'll spoil the punch line and let you know now…I have some bad news.
The Logic Behind the 90/10 Suggestion
When a whole life insurance policy includes a paid-up additions rider, it generally has a higher rate of return. Careful about how to interpret that last statement. I didn't say that the mere presence of paid-up additions is–all on its own–a good signal of a better rate of accumulation on your cash value. I specifically used the word rider because it matters.
Following that idea that if a little is good more must be better, the 90/10 suggestion assumes that more paid-up additions are always a good thing. This makes sense depending on how little you know about whole life insurance.
While this approach is strong for highlighting a lot of cash value in the whole life policy following the first policy year, it can fall behind other designs longer term. And since most people don't buy whole life policies with an intention of keeping them for just one year, it's well worth exploring the impact this approach has on cash value development 10, 20, 30, etc. years into the future.
The reason the 90/10 idea may fail to produce the best rate of return–also known as the most cash value possible–in a whole life insurance policy has to do with how insurers treat revenue generated from other policy components and lost revenue when the insurers income–i.e. the premiums you pay–comes from PUA's. This isn't the first time, I've addressed this fact on The Insurance Pro Blog. Back in 2013, I wrote this article explaining why we can't have axiomatic approaches to policy design. The final bottom line point of that blog post is just as true today as it was back then. The idea of more is better when it comes to elements like paid-up additions and blending is conceptually correct, but there are real-life application implications that can and do significantly alter the results for better or worse. Ignoring that reality leaves us with sub-optimal policies.
Evaluating the Design
I took a look at three companies and their whole life products. Companies include: Guardian Life, MassMutual, and Penn Mutual Two of them–Guardian and MassMutual–will allow the 90/10 design; one of them–Penn Mutual–will not. So I'll have to settle for the closest I can get in the case of Penn Mutual. Here are the ledgers from each one:
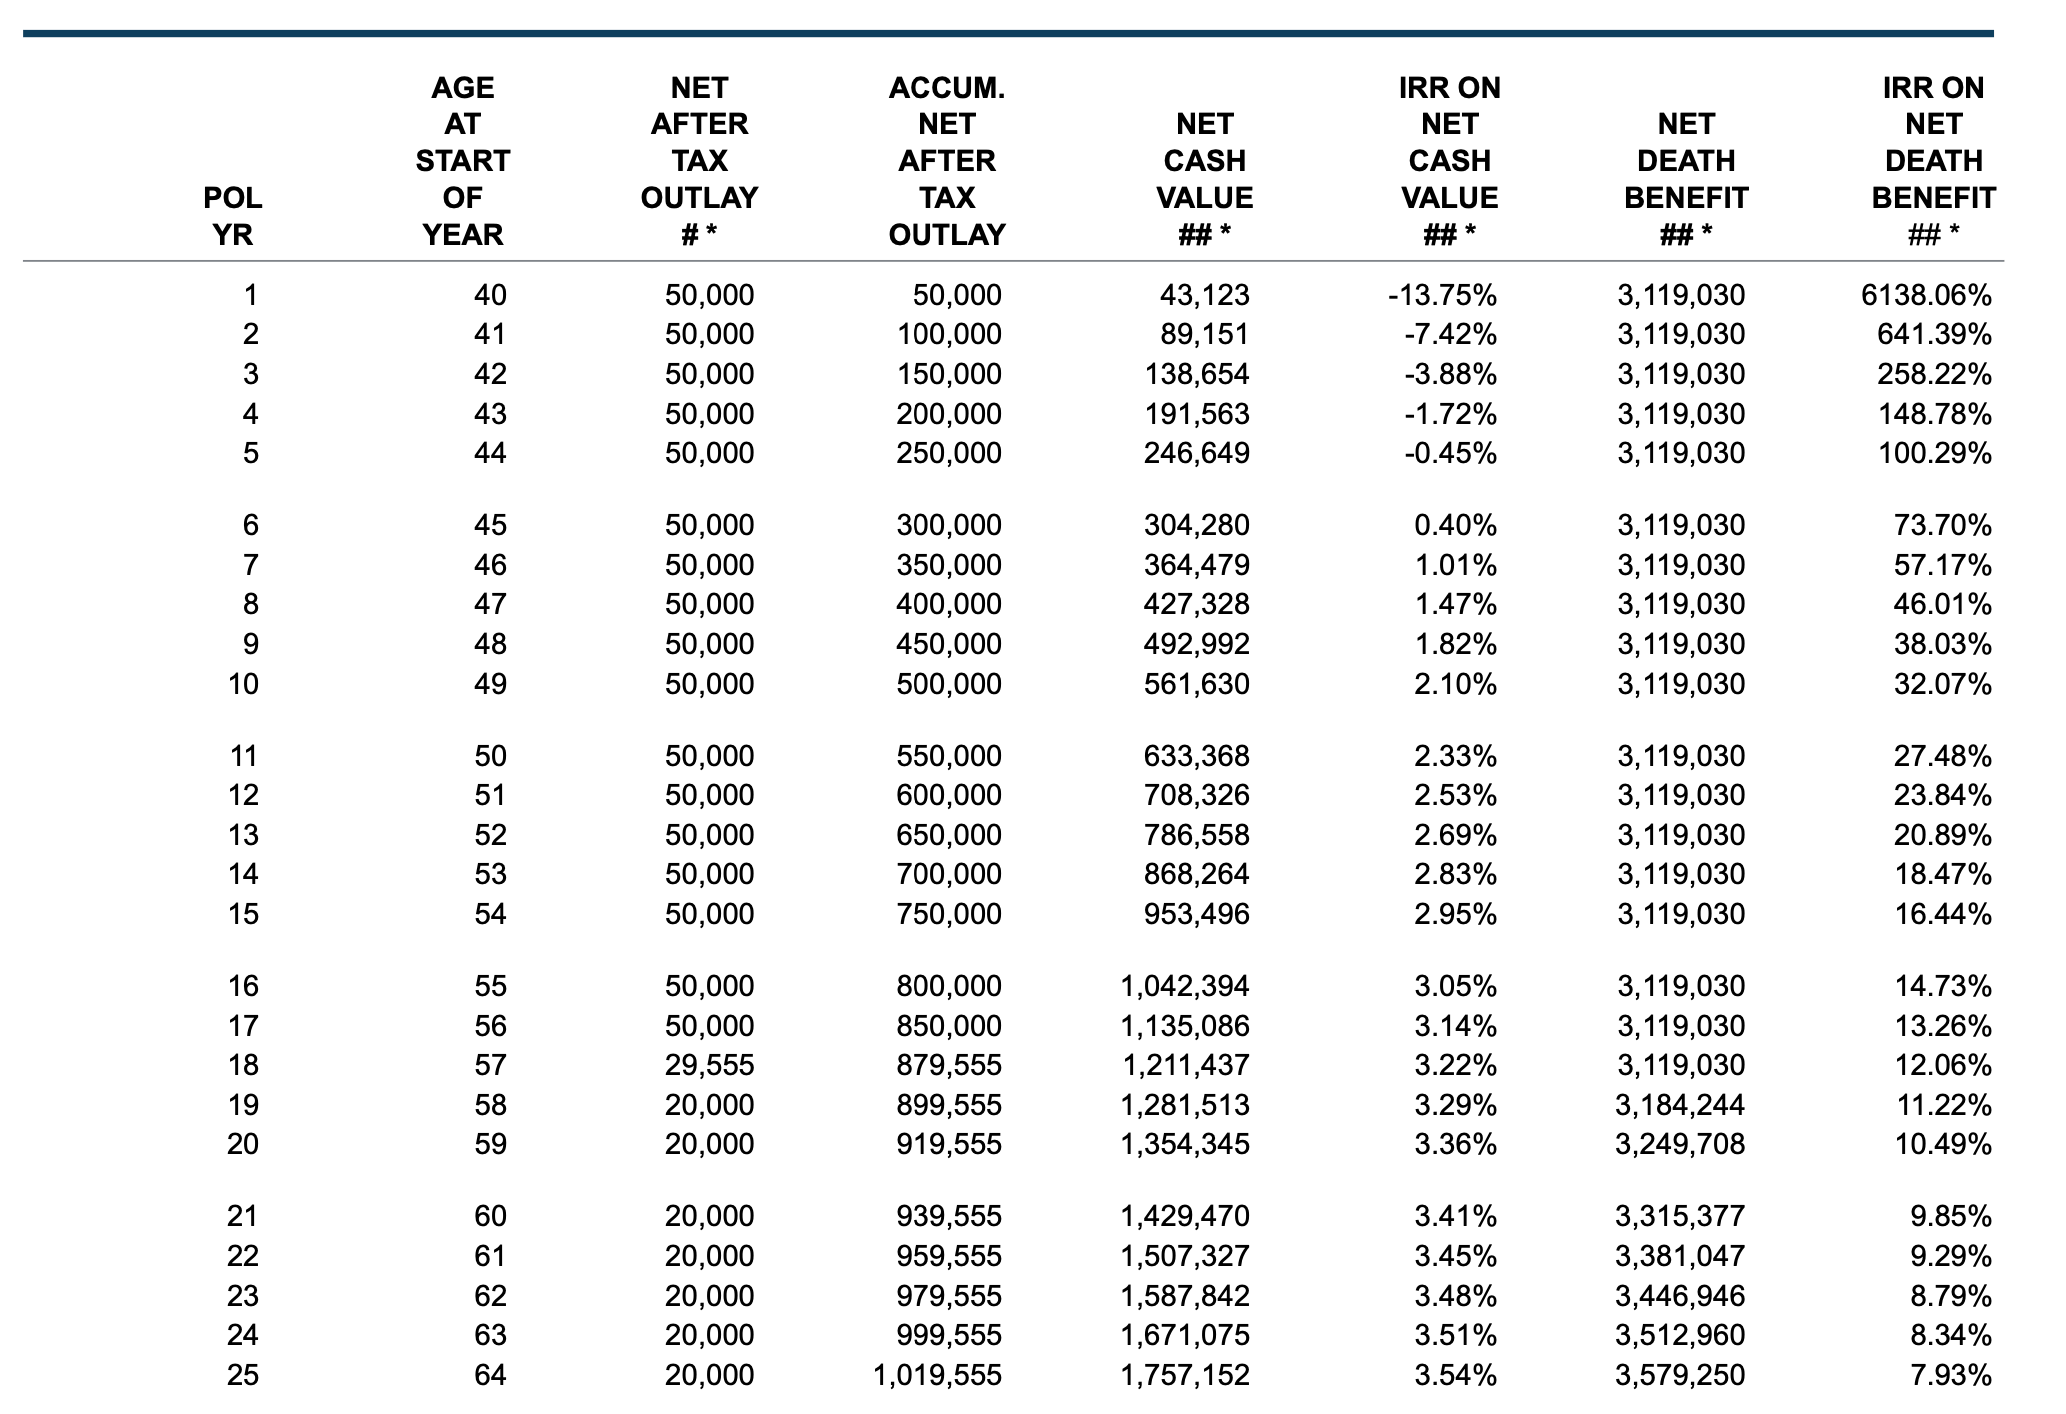
Guardian 90/10 Design
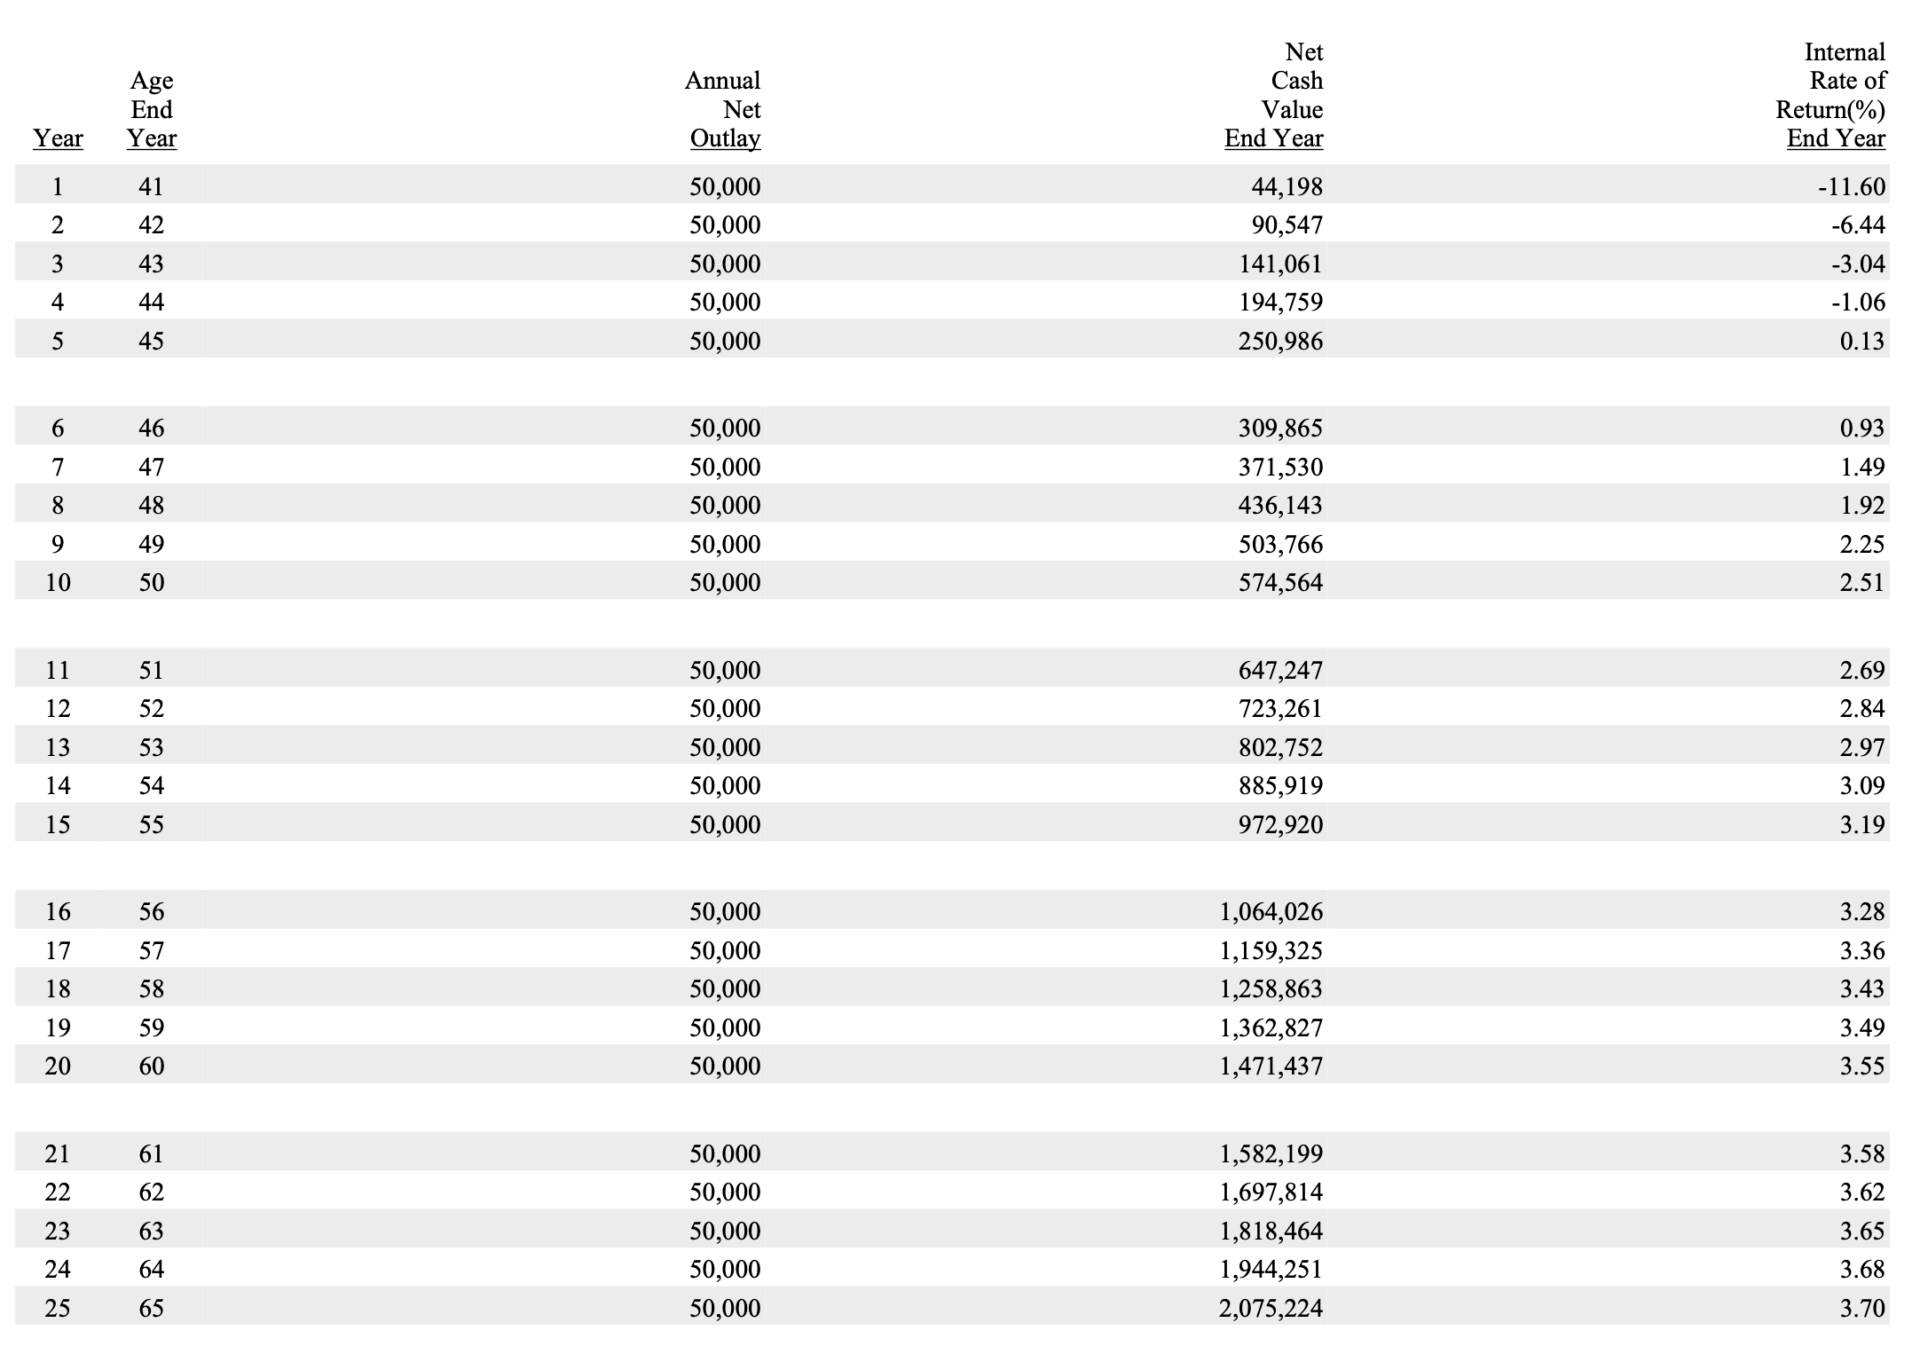
MassMutual 90/10 Design
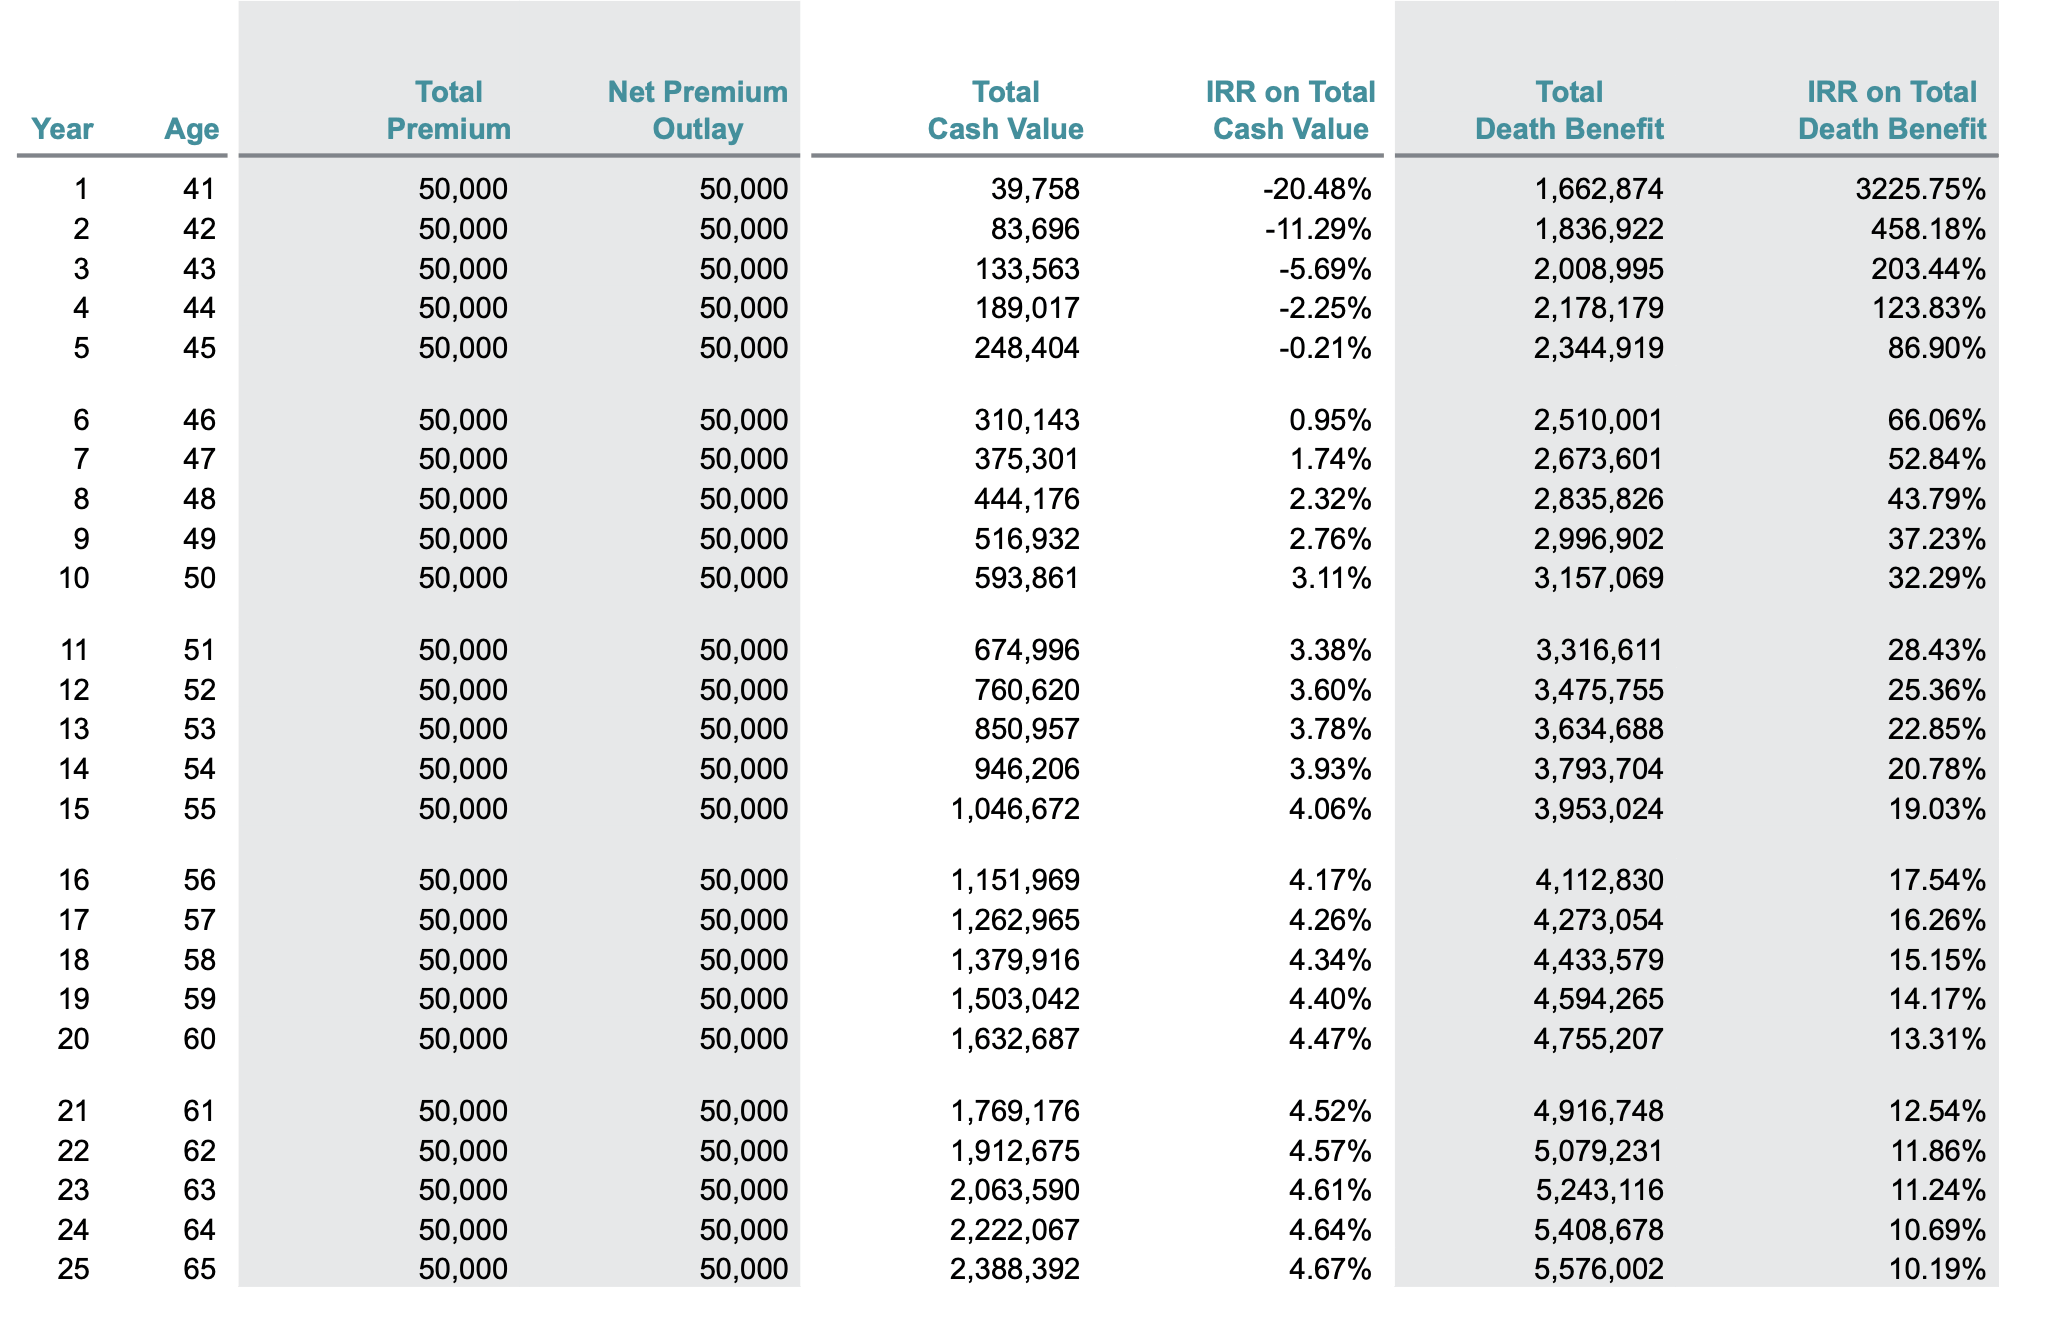
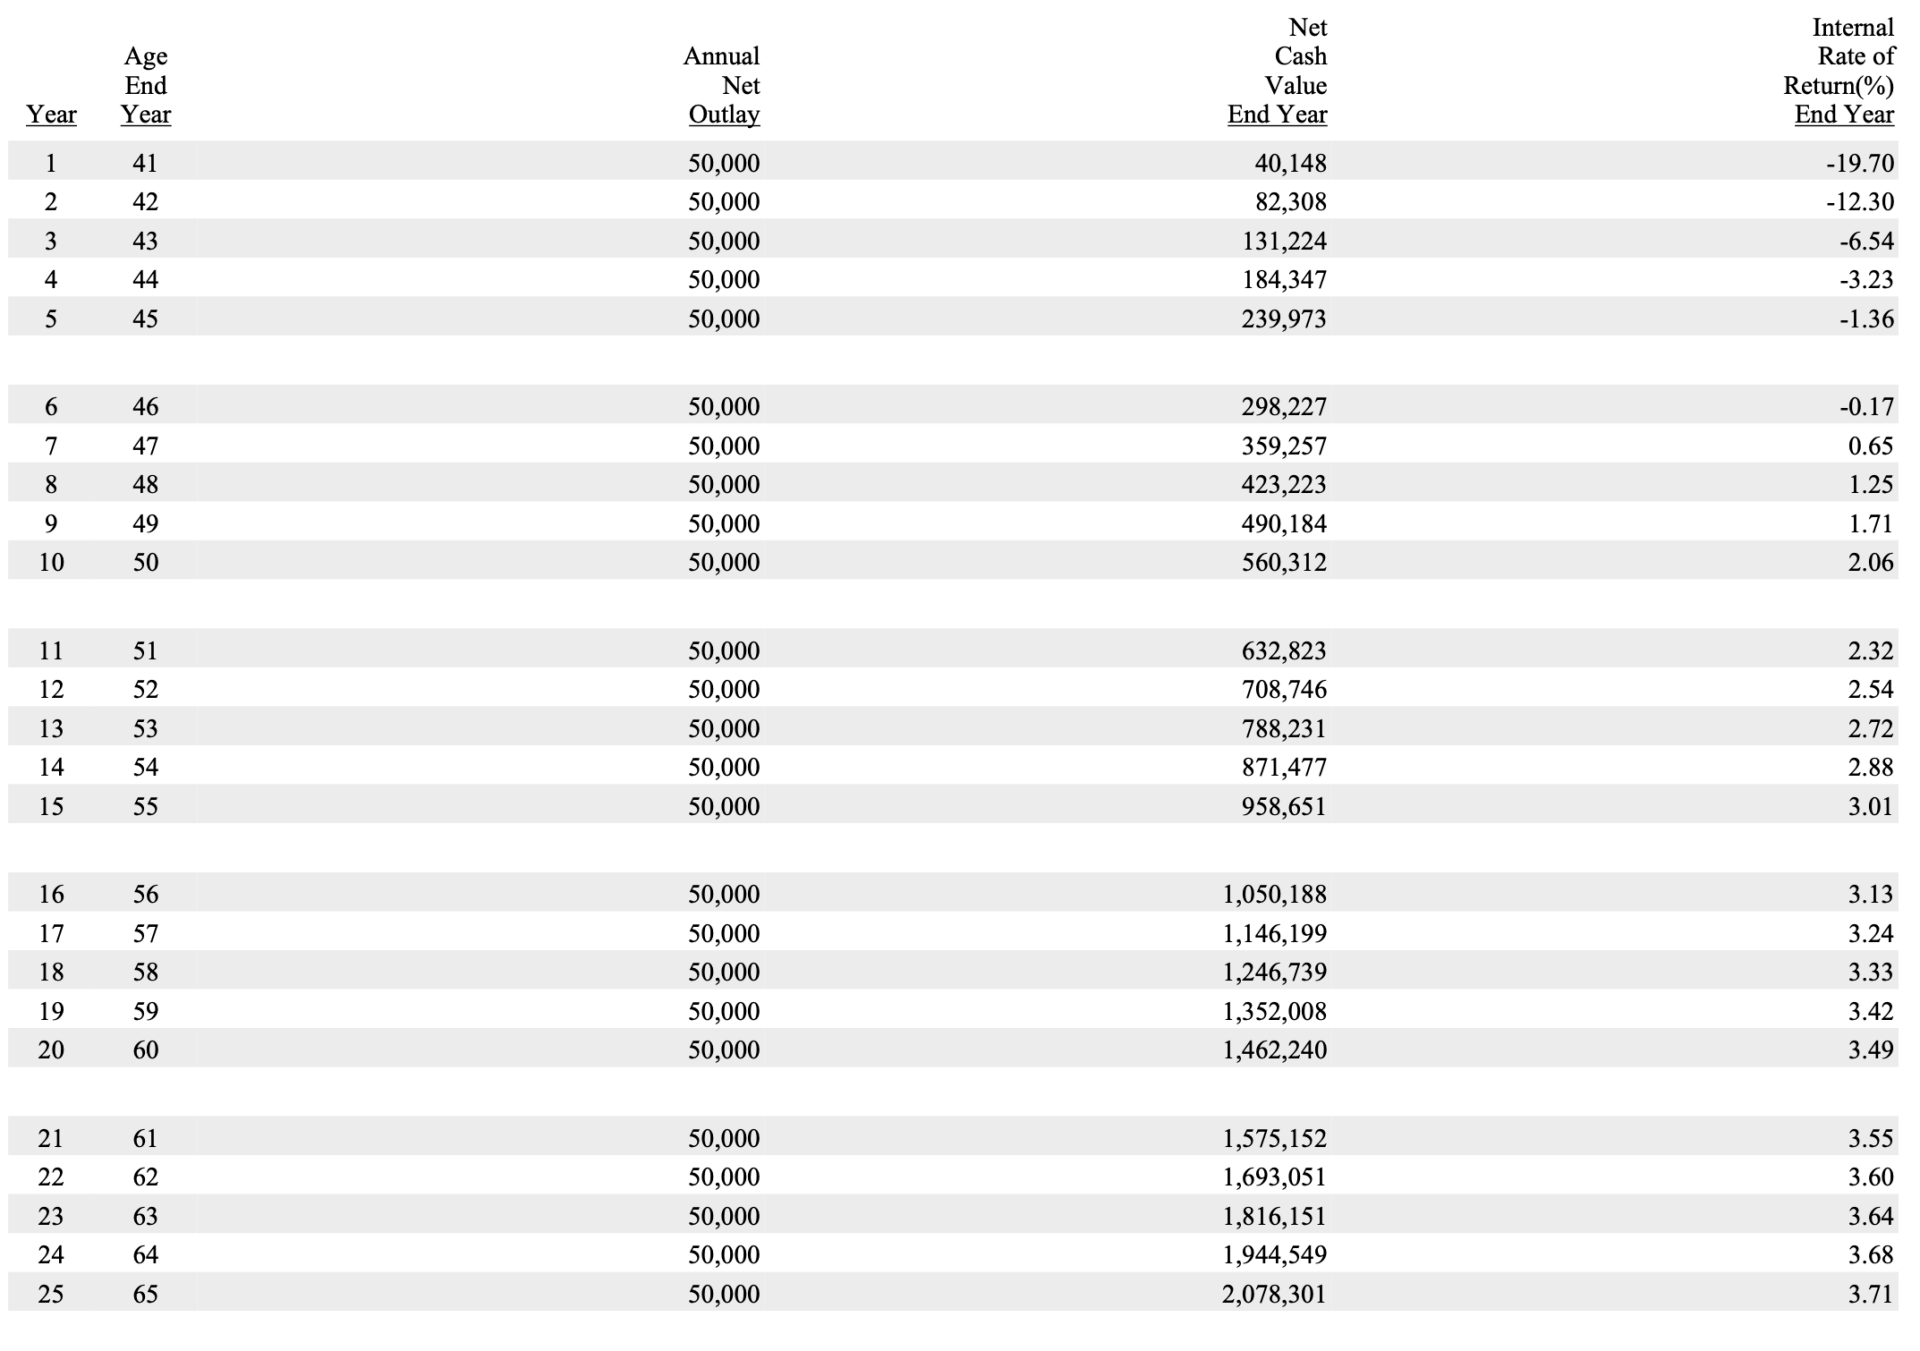
 Penn Mutual about 83/17 Design
 I've included the internal rate of return ledgers for this comparison, which became very important because Guardian runs into a funding limitation due to company policy that limits the paid-up additions rider over time. So while Guardian won't allow the same amount of money into its whole life product as MassMutual and Penn Mutual, we can still use IRR to evaluate the best policyholder cash value bang for the premium buck.
If 90/10 is truly the mecca of whole life design, the MassMutual and Guardian policies should show a higher rate for return versus Penn Mutual. This is not the case. Keep in mind that I cannot put this Penn Mutual policy together with a 90/10 design. Due to company limitations, I simply cannot get there in this scenario.
This example does begin to discredit the claim that 90/10 is the bee's knees, but the proponents would be smart the fight back with the claim that 90/10 does work where it's allowed. Surely 90/10 is the superior approach for Guardian and MassMutual and no other mix of base whole life to paid-up additions would come out better.
Nope.
Here are 80/20 designs for both companies:
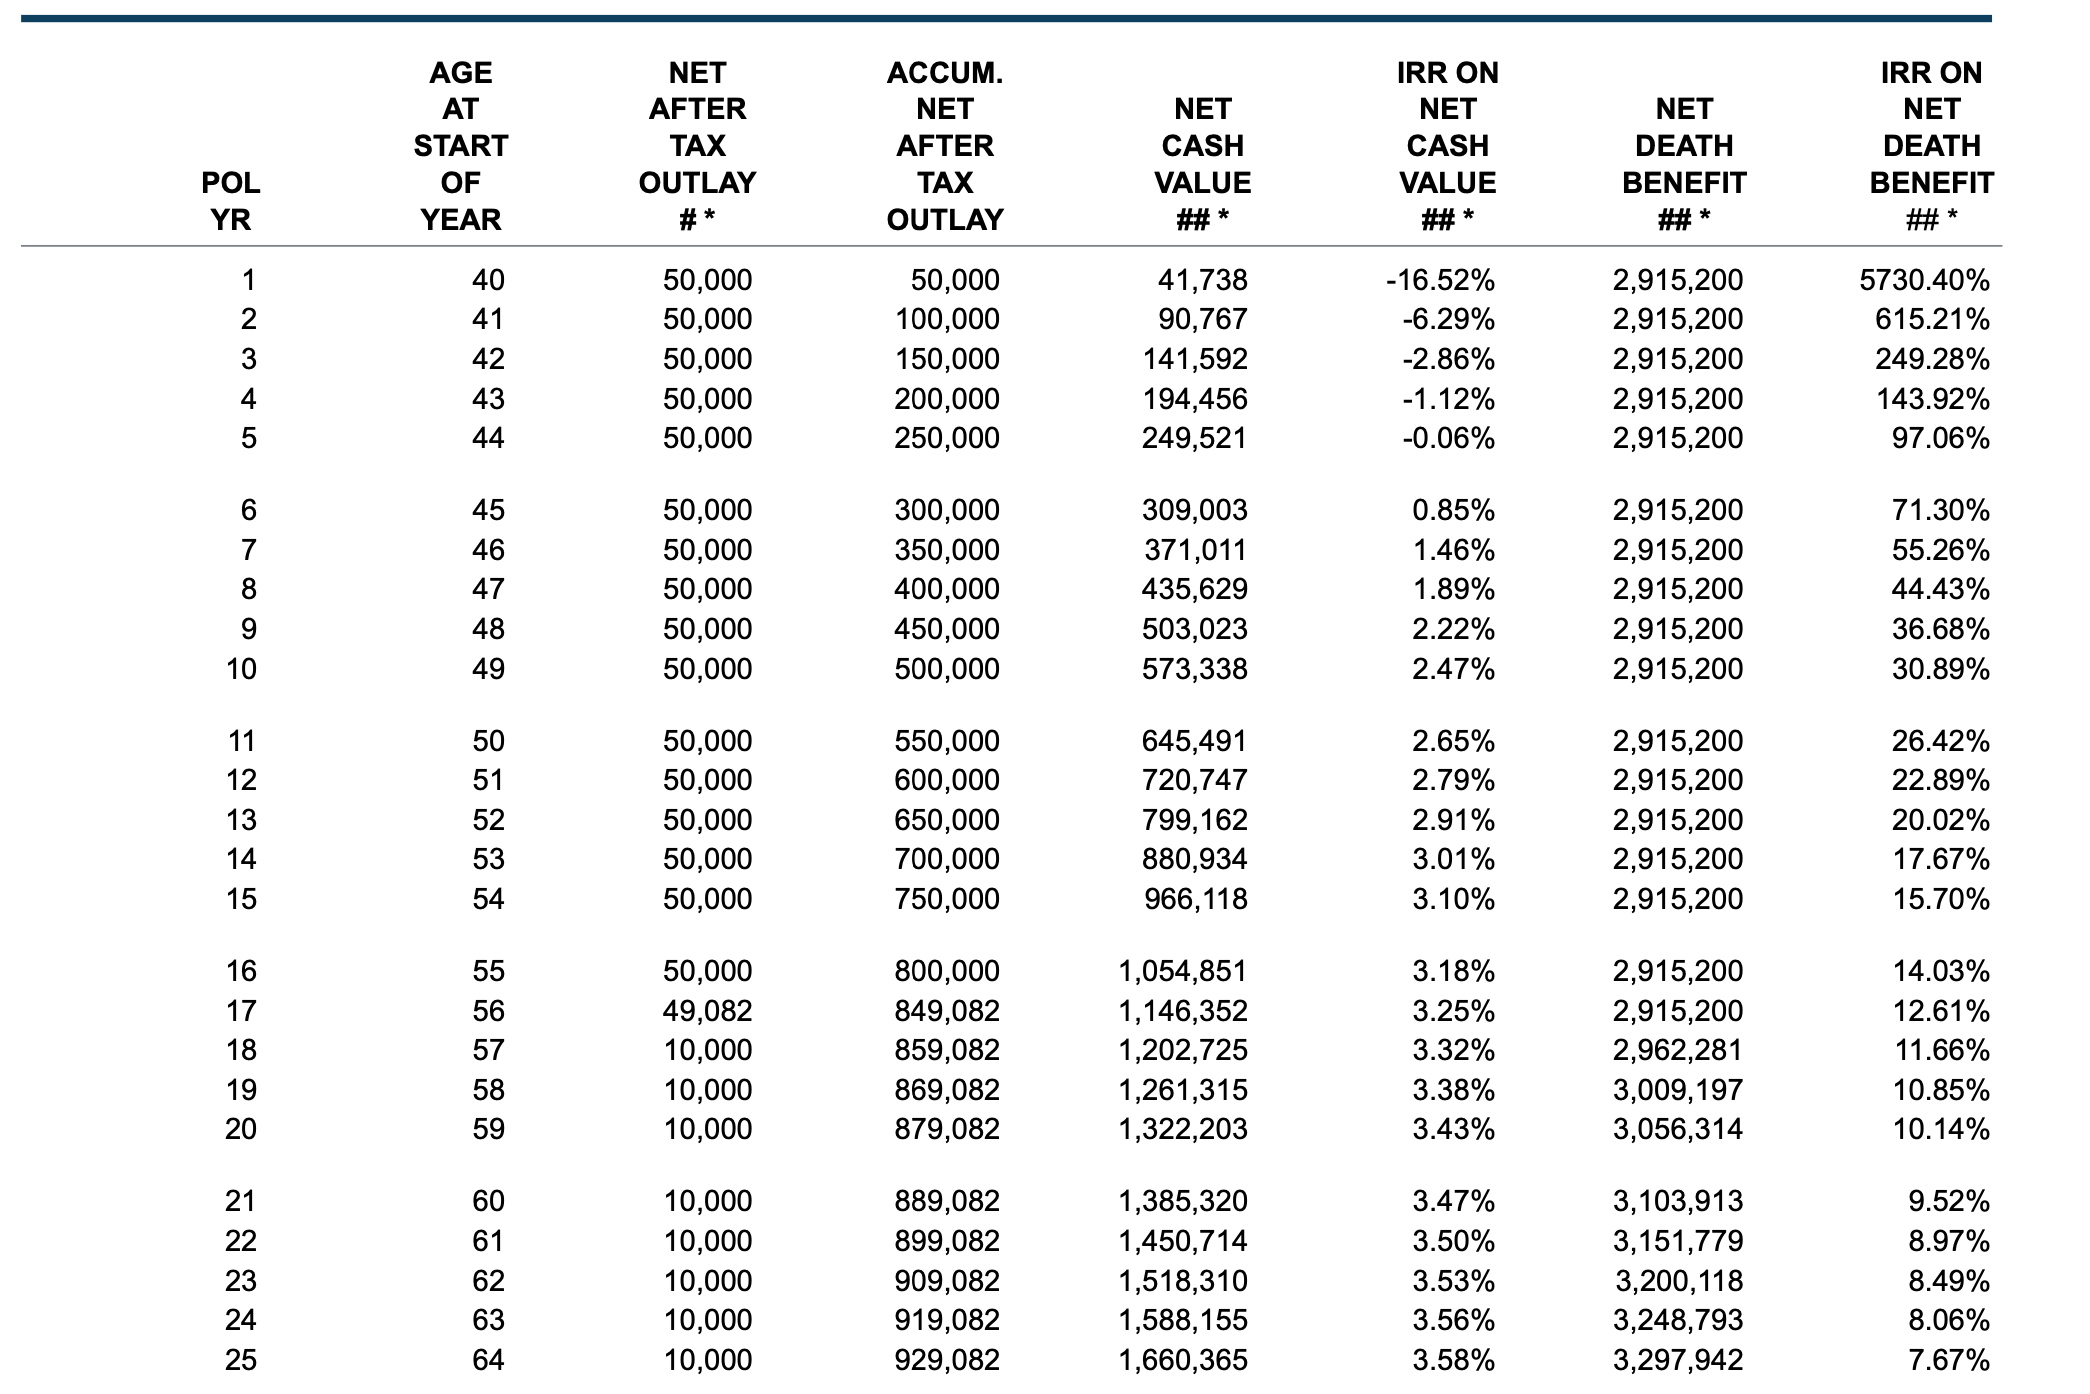
Guardian 80/20 Design
MassMutual 80/20 Design
Now, the MassMutual 80/20 does lag the 90/10 design for a long time, but the 80/20 approach does eventually catch up. The Guardian policy does face a harsher restriction in terms of premium later on in the policy, but the internal rate of return is better. I'm also willing to bet that if I took more time to fine-tune these policies, I could get even better results for both companies–80/20 may not be the best bet.
Moral of the Story
There is no universally correct way to design a whole life policy for all situations. While there may be broader patterns we can use; they only speed up the process by starting closer to the finish line each time. They are not themselves the finish line. Furthermore, there is no universally correct or incorrect approach to which we as agents should always default.
We have to take each potential client's circumstances and goals into account and design a policy around that individual. We need to use a design that best accommodates what he or she seeks to accomplish. This also means experience and expertise matter. We say it depends a lot because it really does depend. Expertise is less about what you know and more about knowing what you don't know.
Brandon,
Just two quick questions/comments:
One, didn’t Penn Mutual used to allow a 4:1 term/PUA DB to base WL DB instead of the only max 2:1 they now allow? Why did they change it….and doesn’t this make the policy somewhat less efficient vs the old 4:1 design with the older product (Flex Choice WL)? IIRC with the old product and design one could (sometimes) get nearly 89 or 90% of the first year’s premium as CV and yet the long-term performance was still superb.
Two, WHY specifically do the non-max blended (i.e. not 90/10 blended or whatever the max blend is) policies come out ahead in the long-term? At first I figured that maybe it was just the Penn policy was more efficient or was assuming a higher dividend rate but the MM and Guardian 80/20 vs the 90/10 policies from the exact same companies (e.g. Guardian vs Guardian and MM vs MM) eventually come out beating the 90/10 ones as well so there goes that theory. Is it just because that (after the big bite of expenses in year 1 and maybe year 2 as well) there are actually LOWER loads/expenses on the base WL than on the term/PUA rider portion (I don’t know if this is the case or not….I don’t sell WL…but it was the only other thing that came immediately to mind)? I know you said in your other post from 2013 or 2014 that something like this couldn’t be explained “in a short 800 word blog post” but I think the exact how and why behind this (non-max blended policies outperforming max blended ones sometimes) would make an interesting/fascinating post in and of itself.
Jacob
Hi Jacob,
1. Yes at one time Penn Mutual did have a whole life product that permitted a larger ratio of term life insurance to base whole life insurance. Keep in mind that this blog post/podcast was more about the ratio of base whole life premium to PUA’s. This being said, the term to base whole life debate is also a common discussion where again the prevailing theory (incorrect theory) is that more term insurance and less base whole life is always better. Why Penn Mutual changed their permitted blending ratio is not information to which I am privy–they hold me in high enough regard to share these sort of things.
2. Because the profitability of a whole life product to the insurer matters and it does affect the overall dividend payable to policyholders. The frustrating part of this is that no insurer will ever tell us specifically what they are looking for in a design to meet a certain profit goal. The actual targets can appear very arbitrary at times. This is something that cannot be easily imparted onto someone. It takes time and a lot of experience looking over various policies, their design, and their resulting values.
I’m not saying your wrong but don’t banks when they get their policies set them up for BOLI don’t they do a 90/10 split from what I have heard?
Traditionally, BOLI is a UL product. So no there wouldn’t be a 90/10 split.