

Podcast: Play in new window | Download
Last week, we discussed the results one could get from indexed universal life insurance from 2001 to 2010. We also looked at how this type of policy performed if the market returns from this time period were repeated over and over again every 10 years. We wanted to evaluate how IUL behaved during a sustained period of mediocre market returns. It turns out indexed universal life insurance does just fine. To check our results, we also looked at the results of a passive index investment during the same time period. Not surprisingly, the index investment performs way short of normalized expectations for stock market returns.
While recording the podcast for last week, we mentioned in passing that these results might look a little differently if we evaluated a similar scenario during an income phase versus an accumulation phase. That's the very task we're accomplishing this week.
IUL and Regular Investment Income Distributions During the Lost Decade
I'm using the accumulated values from last week's analysis as our starting point for income. I'm taking 5.5% of the cash value generated by the indexed universal life policy that used a standard 1-year point-to-point S&P 500 index with an 8% cap as our income basis. This means we'll be distributing $43,466 per year from each scenario and then calculating the rate of return–expressed by internal rate of return also known as the money-weighted rate of return. Loans for IUL scenarios are assumed indexed loans at a 6% accumulation rate in all years.
I'm going to evaluate this scenario using another 20 year test period, which will assume the same market return taking place in repeat. So just like last week, I'm simply taking the 2001-2010 results and repeating them every 10 years. I'm also going to add a 50/50 stock and bond scenario for the investment. I'll keep the Vanguard 500 Fund to represent the passive stock market investment and I'll use the Vanguard Total Bond Index (VBMFX) to represent the bond component.
Results of the Analysis
Standard S&P 1-year Point-to-Point with 8% Cap
| Year | Age | Premium | Premium Charge | Policy fee | Per 1000 | COI | TOTAL | S&P 500 Return | Cash Value | Loan Balance | Net Cash Surrender Value | |
| 21 | 61 | 0 | 0 | 60 | 0 | 1,558 | 1,618 | 1.00% | 790,308 | 46,074 | 744,234 | |
| 22 | 62 | 0 | 0 | 60 | 0 | 1,487 | 1,547 | 1.00% | 798,211 | 94,912 | 703,298 | |
| 23 | 63 | 0 | 0 | 60 | 0 | 1,367 | 1,427 | 8.00% | 862,068 | 146,681 | 715,387 | |
| 24 | 64 | 0 | 0 | 60 | 0 | 1,348 | 1,408 | 8.00% | 931,033 | 201,556 | 729,477 | |
| 25 | 65 | 0 | 0 | 60 | 0 | 1,451 | 1,511 | 4.69% | 974,698 | 259,723 | 714,975 | |
| 26 | 66 | 0 | 0 | 60 | 0 | 1,540 | 1,600 | 8.00% | 1,052,674 | 321,381 | 731,294 | |
| 27 | 67 | 0 | 0 | 60 | 0 | 1,732 | 1,792 | 3.65% | 1,091,097 | 386,737 | 704,360 | |
| 28 | 68 | 0 | 0 | 60 | 0 | 1,938 | 1,998 | 1.00% | 1,102,008 | 456,016 | 645,992 | |
| 29 | 69 | 0 | 0 | 60 | 0 | 2,161 | 2,221 | 8.00% | 1,190,169 | 529,450 | 660,718 | |
| 30 | 70 | 0 | 0 | 60 | 0 | 2,408 | 2,468 | 8.00% | 1,285,382 | 607,291 | 678,091 | |
| 30 Year IRR | 4.34% | |||||||||||
| 31 | 71 | 0 | 0 | 60 | 0 | 2,682 | 2,742 | 1.00% | 1,298,236 | 689,803 | 608,433 | |
| 32 | 72 | 0 | 0 | 60 | 0 | 2,745 | 2,805 | 1.00% | 1,311,218 | 777,265 | 533,953 | |
| 33 | 73 | 0 | 0 | 60 | 0 | 2,762 | 2,822 | 8.00% | 1,416,116 | 869,975 | 546,141 | |
| 34 | 74 | 0 | 0 | 60 | 0 | 2,693 | 2,753 | 8.00% | 1,529,405 | 968,247 | 561,158 | |
| 35 | 75 | 0 | 0 | 60 | 0 | 2,493 | 2,553 | 4.69% | 1,601,134 | 1,072,416 | 528,718 | |
| 36 | 76 | 0 | 0 | 60 | 0 | 2,063 | 2,123 | 8.00% | 1,729,225 | 1,182,835 | 546,390 | |
| 37 | 77 | 0 | 0 | 60 | 0 | 2,459 | 2,519 | 3.65% | 1,792,341 | 1,299,879 | 492,462 | |
| 38 | 78 | 0 | 0 | 60 | 0 | 2,922 | 2,982 | 1.00% | 1,810,265 | 1,423,946 | 386,319 | |
| 39 | 79 | 0 | 0 | 60 | 0 | 3,465 | 3,525 | 8.00% | 1,955,086 | 1,555,457 | 399,629 | |
| 40 | 80 | 0 | 0 | 60 | 0 | 4,115 | 4,175 | 8.00% | 2,111,493 | 1,694,858 | 416,635 | |
| 40 Year IRR | 4.17% |
Uncapped S&P Index
| Year | Age | Premium | Premium Charge | Policy fee | Per 1000 | COI | TOTAL | S&P 500 Return | Cash Value | Loan Balance | Net Cash Surrender Value | |
| 21 | 61 | 0 | 0 | 60 | 0 | 1,558 | 1,618 | 1.00% | 763,011 | 46,074 | 716,937 | |
| 22 | 62 | 0 | 0 | 60 | 0 | 1,487 | 1,547 | 1.00% | 770,641 | 94,912 | 675,729 | |
| 23 | 63 | 0 | 0 | 60 | 0 | 1,367 | 1,427 | 8.00% | 832,293 | 146,681 | 685,612 | |
| 24 | 64 | 0 | 0 | 60 | 0 | 1,348 | 1,408 | 8.00% | 898,876 | 201,556 | 697,320 | |
| 25 | 65 | 0 | 0 | 60 | 0 | 1,451 | 1,511 | 4.69% | 941,034 | 259,723 | 681,310 | |
| 26 | 66 | 0 | 0 | 60 | 0 | 1,540 | 1,600 | 8.00% | 1,016,316 | 321,381 | 694,936 | |
| 27 | 67 | 0 | 0 | 60 | 0 | 1,732 | 1,792 | 3.65% | 1,053,412 | 386,737 | 666,674 | |
| 28 | 68 | 0 | 0 | 60 | 0 | 1,938 | 1,998 | 1.00% | 1,063,946 | 456,016 | 607,930 | |
| 29 | 69 | 0 | 0 | 60 | 0 | 2,161 | 2,221 | 8.00% | 1,149,062 | 529,450 | 619,611 | |
| 30 | 70 | 0 | 0 | 60 | 0 | 2,408 | 2,468 | 8.00% | 1,240,986 | 607,291 | 633,695 | |
| 30 Year IRR | 4.14% | |||||||||||
| 31 | 71 | 0 | 0 | 60 | 0 | 2,682 | 2,742 | 1.00% | 1,253,396 | 689,803 | 563,593 | |
| 32 | 72 | 0 | 0 | 60 | 0 | 2,745 | 2,805 | 1.00% | 1,265,930 | 777,265 | 488,665 | |
| 33 | 73 | 0 | 0 | 60 | 0 | 2,762 | 2,822 | 8.00% | 1,367,205 | 869,975 | 497,230 | |
| 34 | 74 | 0 | 0 | 60 | 0 | 2,693 | 2,753 | 8.00% | 1,476,581 | 968,247 | 508,334 | |
| 35 | 75 | 0 | 0 | 60 | 0 | 2,493 | 2,553 | 4.69% | 1,545,833 | 1,072,416 | 473,417 | |
| 36 | 76 | 0 | 0 | 60 | 0 | 2,063 | 2,123 | 8.00% | 1,669,499 | 1,182,835 | 486,664 | |
| 37 | 77 | 0 | 0 | 60 | 0 | 2,459 | 2,519 | 3.65% | 1,730,436 | 1,299,879 | 430,557 | |
| 38 | 78 | 0 | 0 | 60 | 0 | 2,922 | 2,982 | 1.00% | 1,747,740 | 1,423,946 | 323,795 | |
| 39 | 79 | 0 | 0 | 60 | 0 | 3,465 | 3,525 | 8.00% | 1,887,560 | 1,555,457 | 332,103 | |
| 40 | 80 | 0 | 0 | 60 | 0 | 4,115 | 4,175 | 8.00% | 2,038,564 | 1,694,858 | 343,707 | |
| 40 Year IRR | 3.98% |
VFINX IRR end of first 10 years = 1.82%
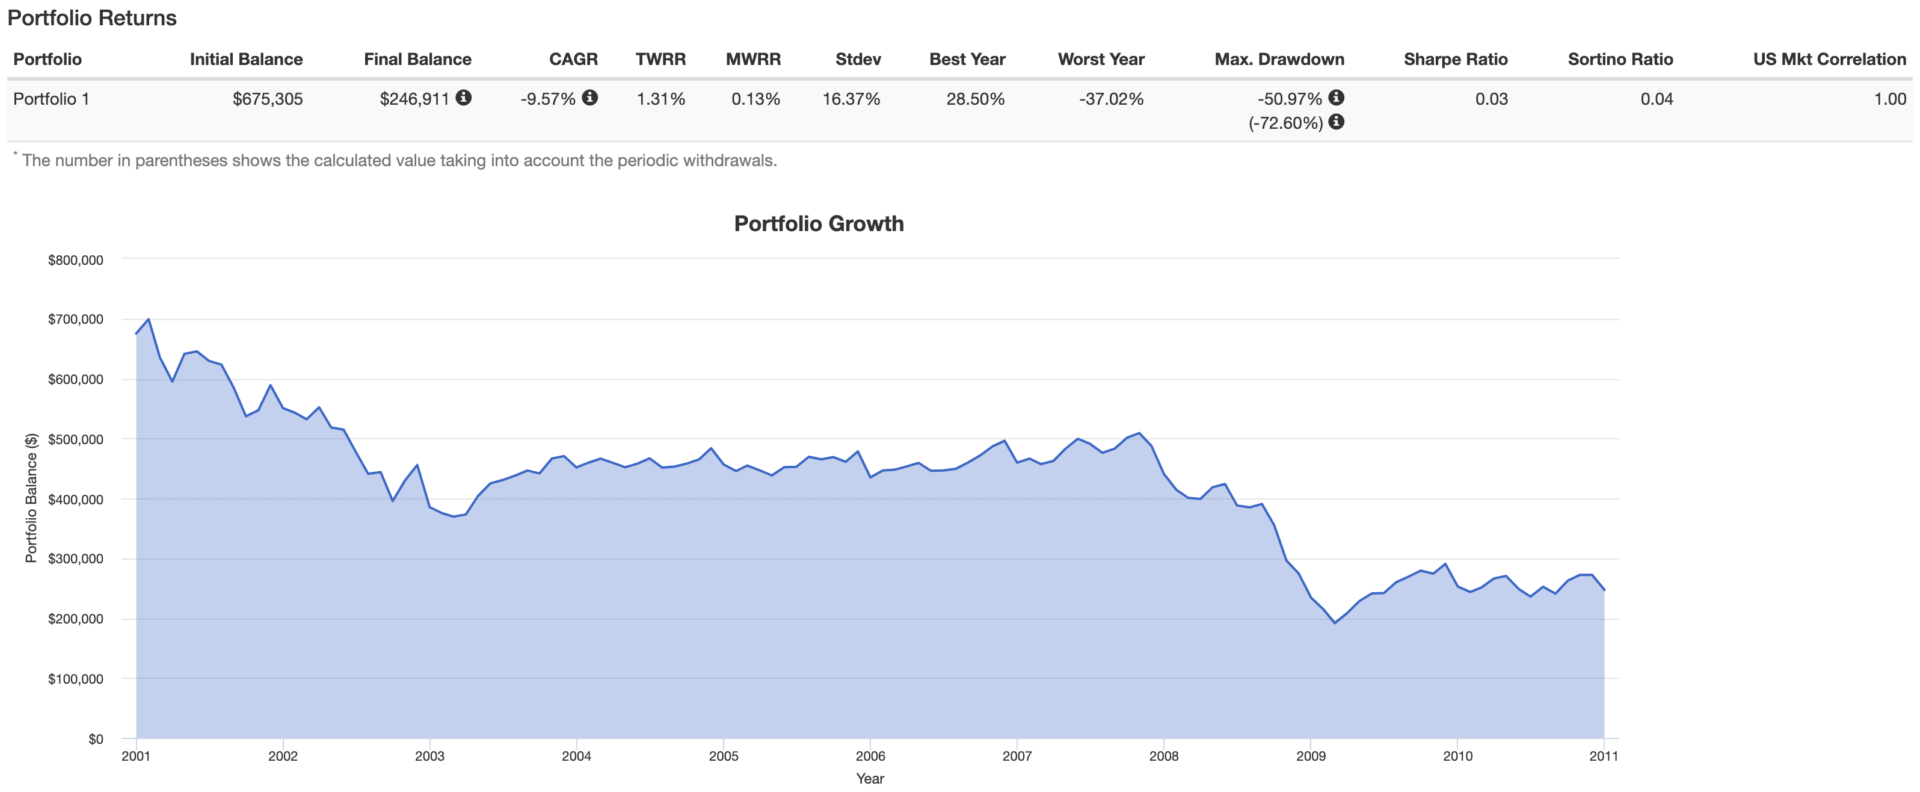
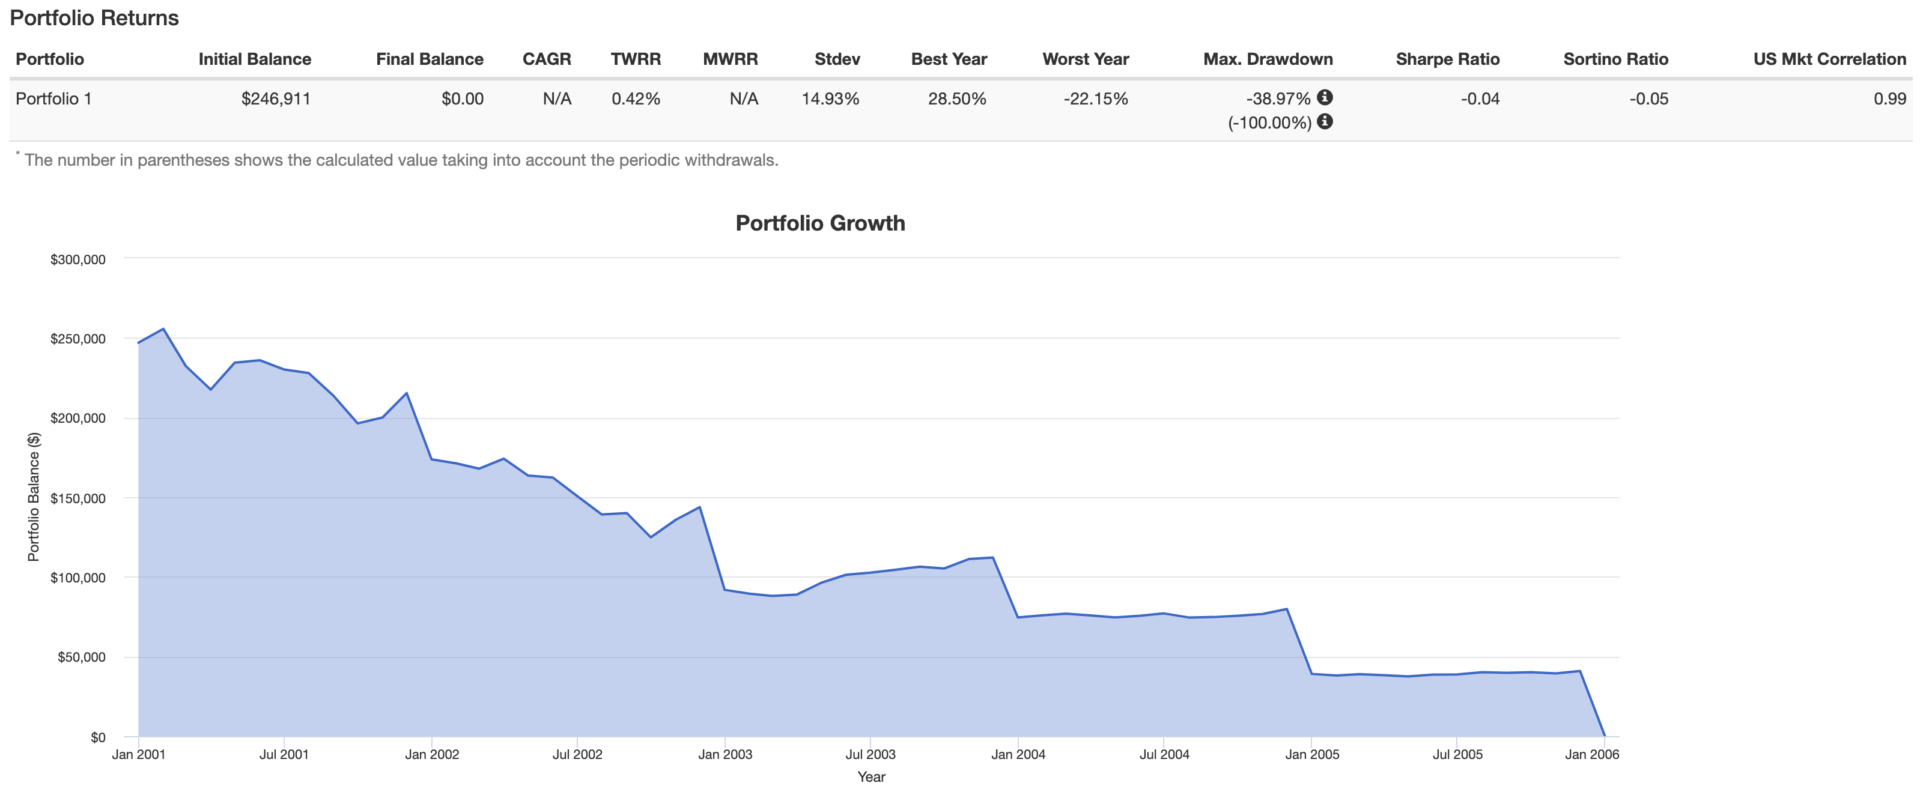
VFINX IRR end of next 10 years = null
50/50 VFINX/VBMFX IRR first 10 years = 3.21%
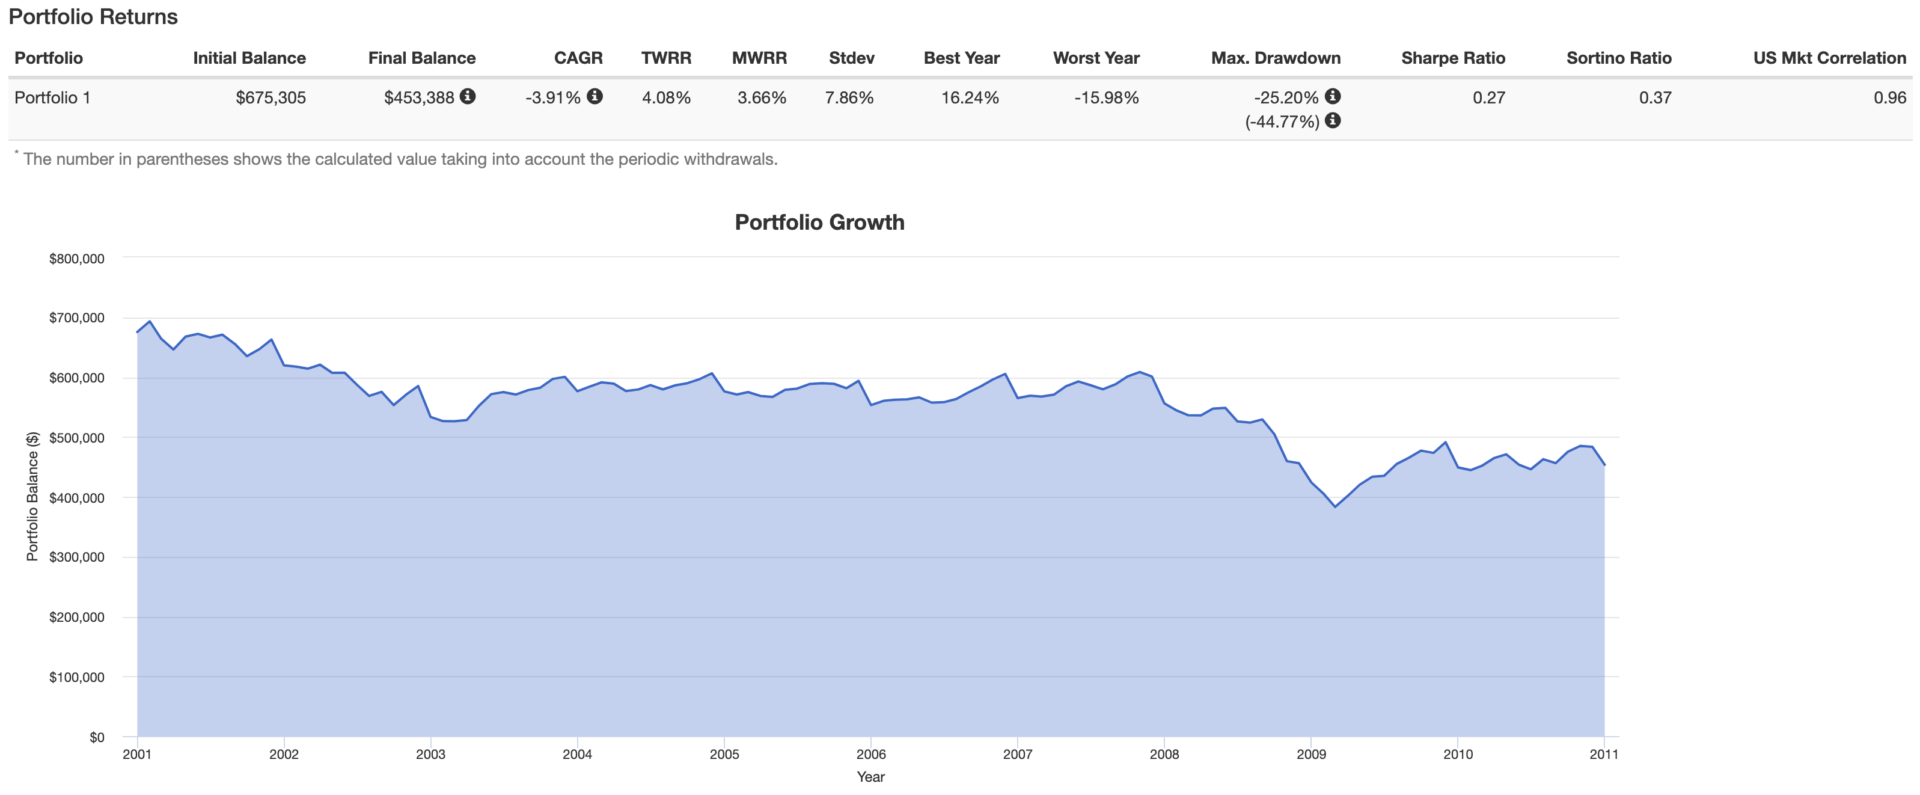
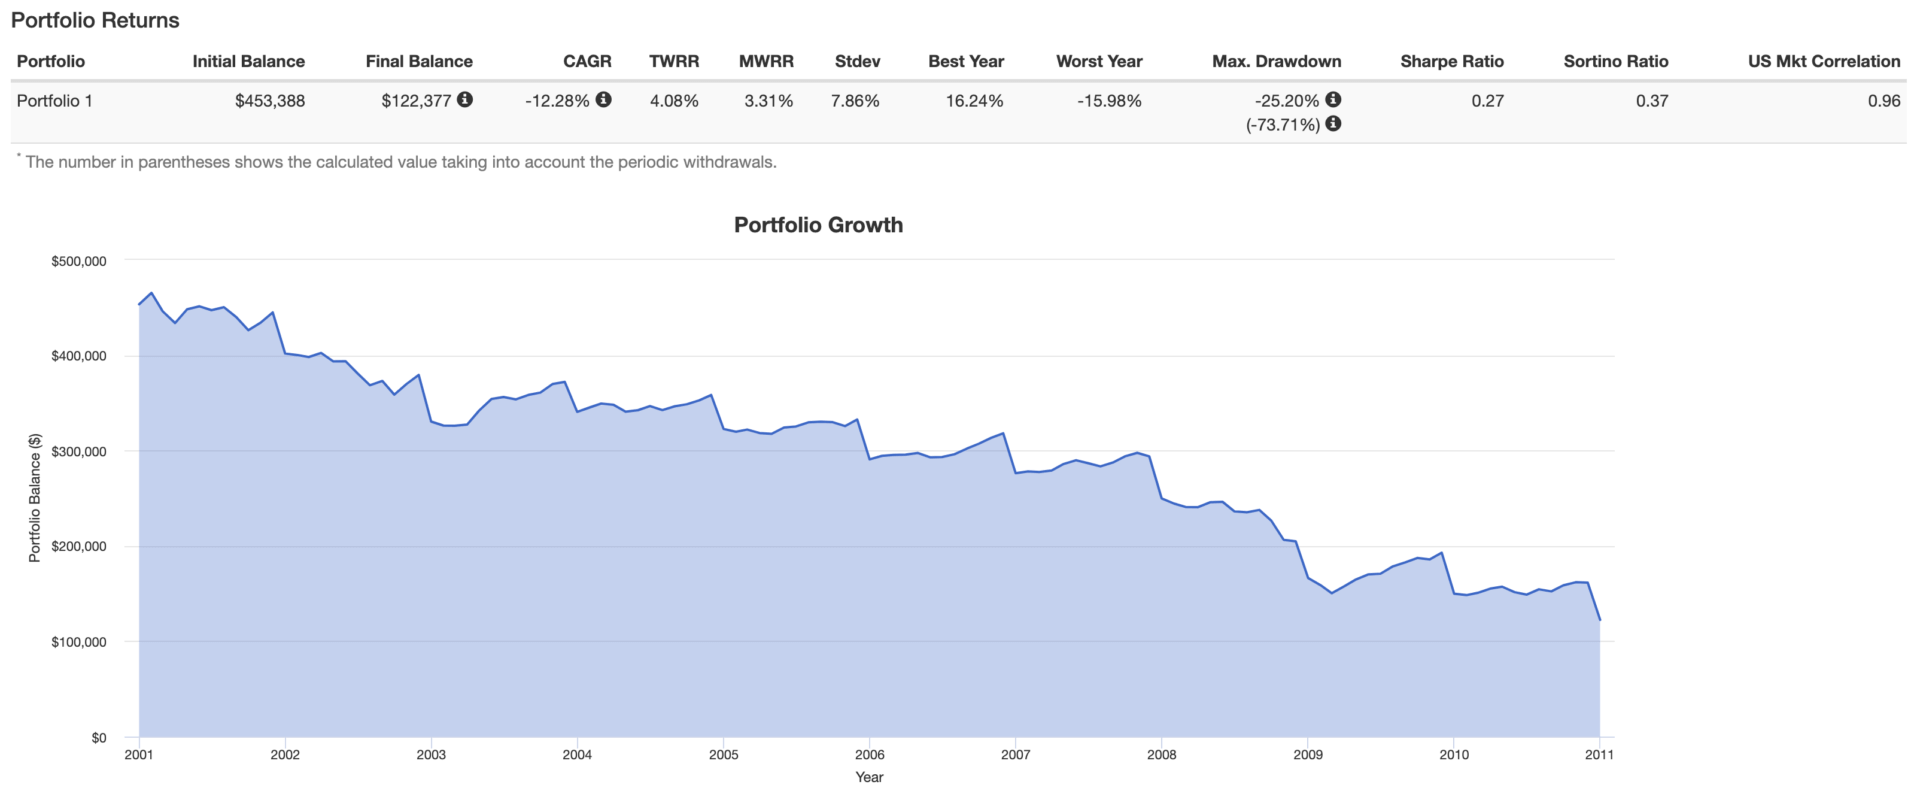
50/50 VFINX/VBMFX IRR second 10 years = 3.29%
Commentary on the Results
As a reminder, income for all scenarios in all years is $43,466 per year. This is 5.5% of the cash surrender value of the 8% cap IUL at the end of year 20 from last week's example (i.e. the end of the accumulation period). One could argue that I should have taken some other number from the resulting end of accumulation period results for each individual option, and this would have resulted in different endpoints for the other scenarios that weren't the 8% capped IUL. This is true, but ultimately, retirement planning is about creating the most amount of income for the dollar saved. Since making this adjustment for the other scenarios would have resulted in lower-income distribution, I find whatever results from this created to be un-remarkable.
It's interesting, though not really surprising, that the passive index investment entirely in the stock market wasn't able to survive the entire 20 year period of the income distribution. Now I'm well aware that customary investment advice would never recommend someone keep 100% of their portfolio in the market and never recommend taking 5.5% of the balance as income in all years. There are two points, however, that I wish to make about this.
First, there are some internet and radio financial warriors out there who have espoused remaining 100% in the market forever or–ideally–as long as possible. Some of them are on recorded YouTube videos making such recommendations to ladies in their elder years. While traditional investment advising would disagree–and disagree correctly with this sentiment–there are people who will go rogue and their investment advice is horrible as it's wildly susceptible to problems highlighted above.
Second, I want to reiterate the fact that I'm trying to suss out what benefit achieved per dollar in. If both IUL policies are capable of sustaining the same income figure despite different beginning account balances, where does that put the market investment?
IUL is Far More Resilient in this Scenario
It's obvious under this scenario indexed universal life insurance shows more resiliency. It's also extremely unlikely that this scenario will ever play out. This isn't a thought exercise attempting to dissuade anyone from owning stocks and bonds and persuade them to load up on life insurance. Instead, I'm using it to highlight that cash value life insurance products have a tactical purpose for risk mitigation.
I strongly doubt we'll see a sustained stock market period like the one in this example. However, I believe that market corrections will take place more than once over the next several decades. These corrections will dramatically alter the results achieved by ordinary investors who use said investment for retirement preparedness. Incorporating fixed universal or dividend-paying whole life insurance into your retirement portfolio will shield you to varying degrees from these potentially life-altering corrections.
What's more, the cost of insurance (COI) reporting in the IUL results is likely overstated as I did not account for the change (reduction) in the net amount at risk in years when index earnings are higher than anticipated from the illustration.
Also, just like last week, the bonus that is a part of this IUL product is still not included. Additionally, income from the investment does not account for taxes due.