

In a traditional whole life insurance policy, you will often see that there is no cash value in the first year. And that continues into the second year or perhaps your policy has a few dollars in cash value in the second year. Seeing so little cash value accumulation is disconcerting for people who buy whole life insurance with an eye toward building their own banking type of policy to access the cash.
It’s also difficult for those who are looking to use their policy for a source of retirement income in the future. The psychological impact of paying thousands in premium to have nothing for years is more than most people can handle.
How long it actually takes for whole life insurance to build a significant amount of cash value really depends on the policy design. In a traditional design, with no term rider and no significant amount of premium being paid toward the paid-up additions rider, the growth of cash is painfully slow.
Just how quickly it accumulates under the traditional design depends on the age of the person that is insured by the policy and the health rating of that person. For example, if someone is a standard risk class as opposed to a preferred plus risk class, the cash value will accumulate more slowly.
Here’s a good comparison of two policies, exactly the same design, a 40-year-old male, non-smoker at preferred plus and the same at standard, see the difference in cash value—he is paying $20,000 each year in premium and plans to pay until he is 66. At that point, the client will exercise the reduced paid-up option. The death benefit will come down a bit and the policy dividends will continue to purchase paid-up additions.
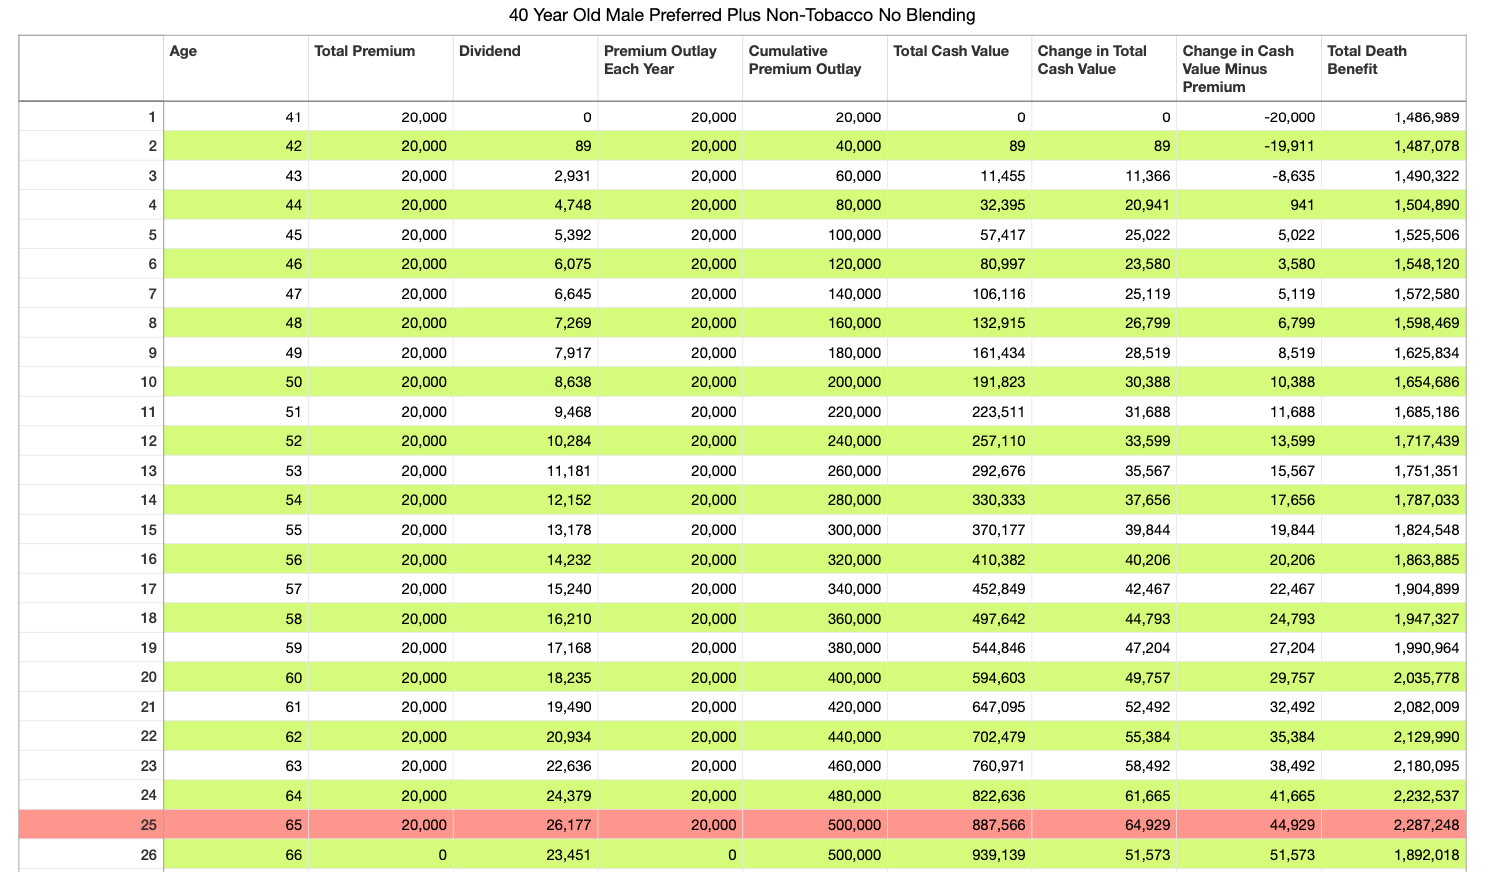
The first two examples depict a traditional design with no paid-up additions or term insurance rider. The first is for the policy at a preferred plus rate, pay attention to cash in the column titled “Total Cash Value”:
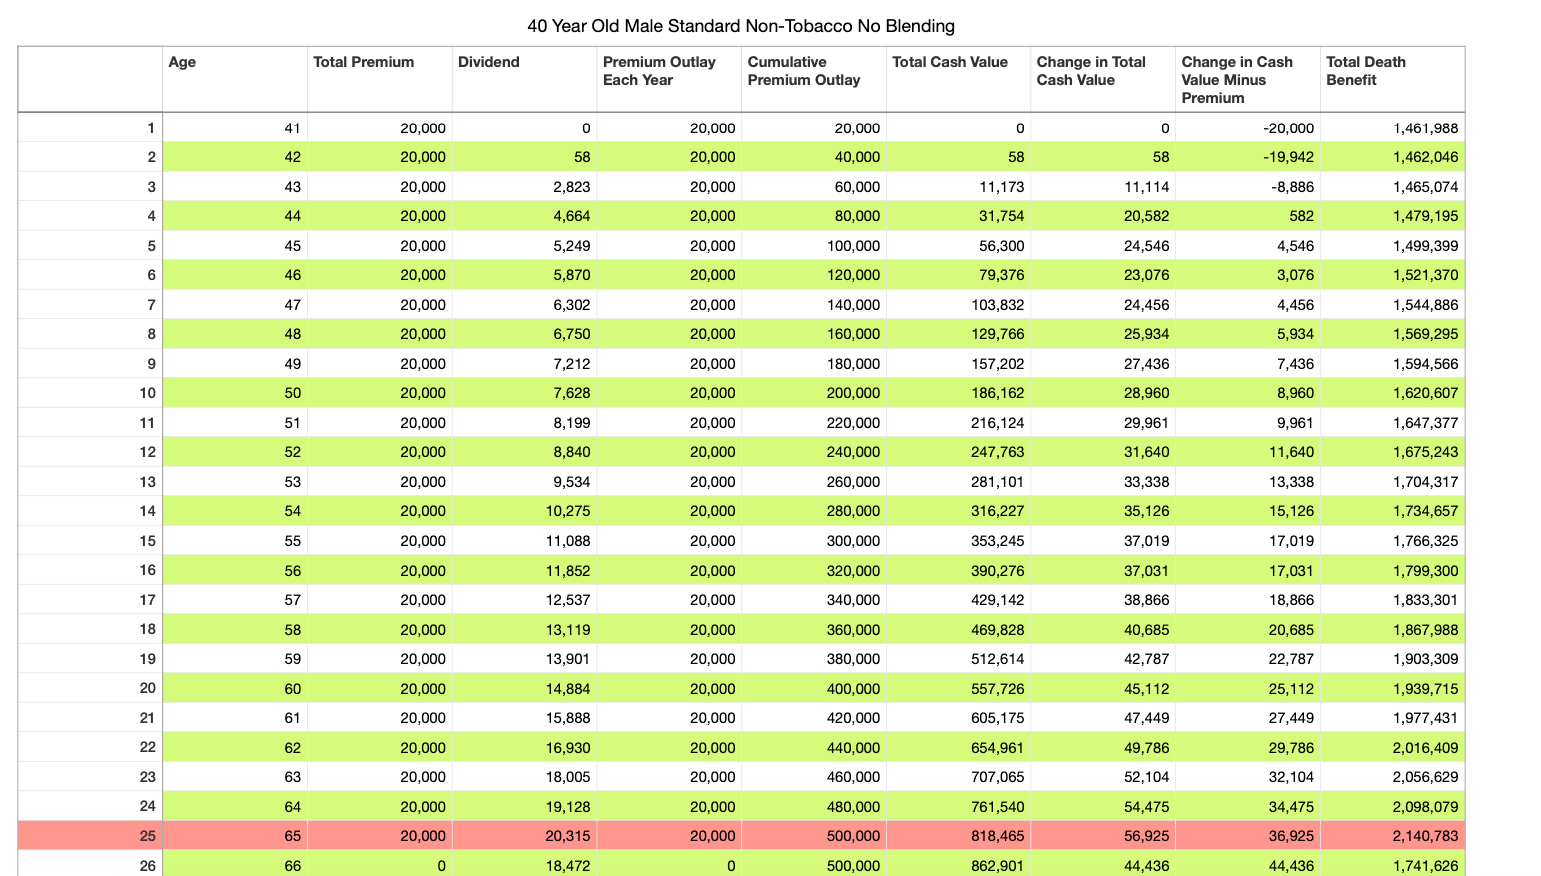
And this is the same policy but at a standard rate, notice the cashvalue difference at age 65 from the preferred plus rate:
If you look closely at the total cash value at the end of the year that our client turns 65, you will notice that the preferred plus rated policy accumulates nearly $70,000 more. The difference in the first few years of the policy seems pretty insignificant.
Both policies have no cash after the first year and get off to a very slow start. Maybe this is why most people think whole life insurance is such a bad idea?
But more to the point here, the compounding of that slight difference between the preferred plus and the standard rating becomes quite significant over time.
Where’s the break-even?
Another key indicator that most people use to measure the success and efficiency of their whole life insurance policy is how quickly the policy hits the break-even point. What does that mean exactly? Well, it’s the point at which the total cash value is equal to or exceeds the cumulative premiums paid.
Let’s look at the two examples above one more time for reference purposes. For example 1, at the end of policy year 11, you can see that the cumulative premium outlay is $220,000 and the total cash value is $223,511. That means that according to this illustration if the dividend holds steady for the next eleven years, this policy will finally begin to have a positive internal rate of return by the end of year 11.
If we take a look at the second example, the same point is reached at the end of the 12th policy year when the total premium outlay is $240,000 and the total cash value is $247,763. Obviously, everyone would prefer the first example to the second, however, nobody really wants to wait that long (in either case) to see a positive result. Though clearly, the policy with the preferred plus rating gets to break-even a year ahead of the standard rated policy.
Can you get more cash value, faster?
I won’t bury the lead here…fortunately we can absolutely force your whole life insurance policy to build cash value more rapidly. And in the process of doing so, achieve a positive internal rate of return much earlier in the lifecycle of the policy.
Again, I have two examples to share with you. These two illustrations were generated using the exact same parameters as the first two examples. The only difference here is that these two policies make use of what we call “blending”. If you want to read more about how that works, check out this article that explains the mechanics.
For now, let’s take a look at the outcome of a blended policy, one that has been designed to achieve maximum efficiency and to build cash value as quickly as possible while of course staying underneath modified endowment contract limits:
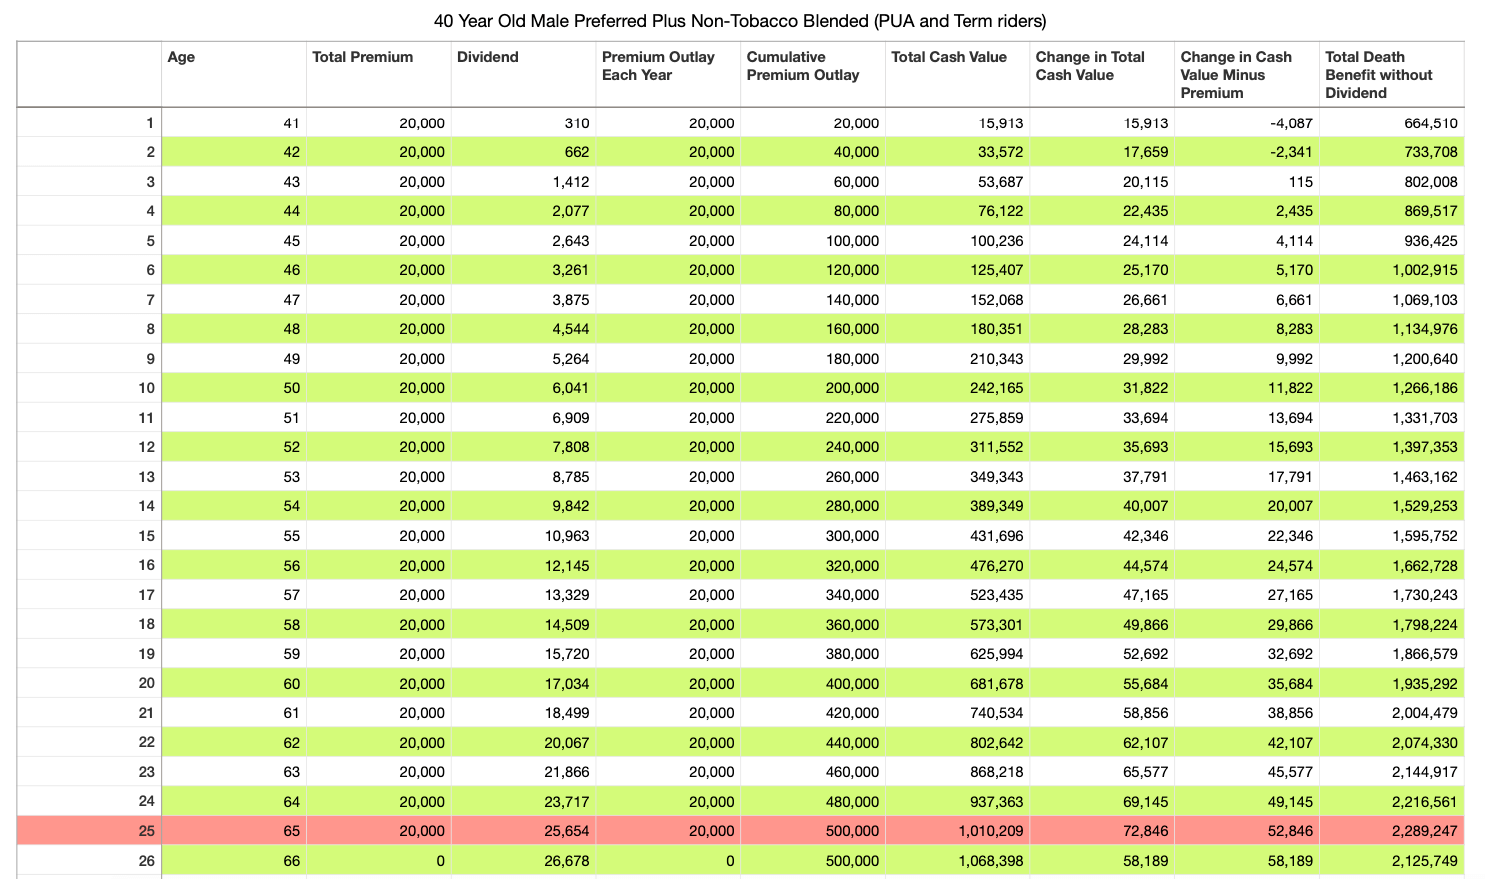
The first illustration is for the same preferred plus rated policy but blended with a term rider and a paid-up additions rider:
There are a few things to point out here…
-
- Notice the total cash value at the end of year one—it is $15,913. Compare that with the same policy from example 1. This is the SAME client, the same policy, only designed differently. In example 1, the cash value at the end of the first year is $0.
- Now follow the total cash value column all the way down to where I’ve highlighted it, at the end of the year the client turns 65. The total cash value here is $1,010,209 versus $887,566. That’s a difference of $122,643. Same client, same policy, same premium outlay, just a different design.
- The break-even point has been reached by the end of policy year 5. That's less than half the time of the non-blended version of the same policy.
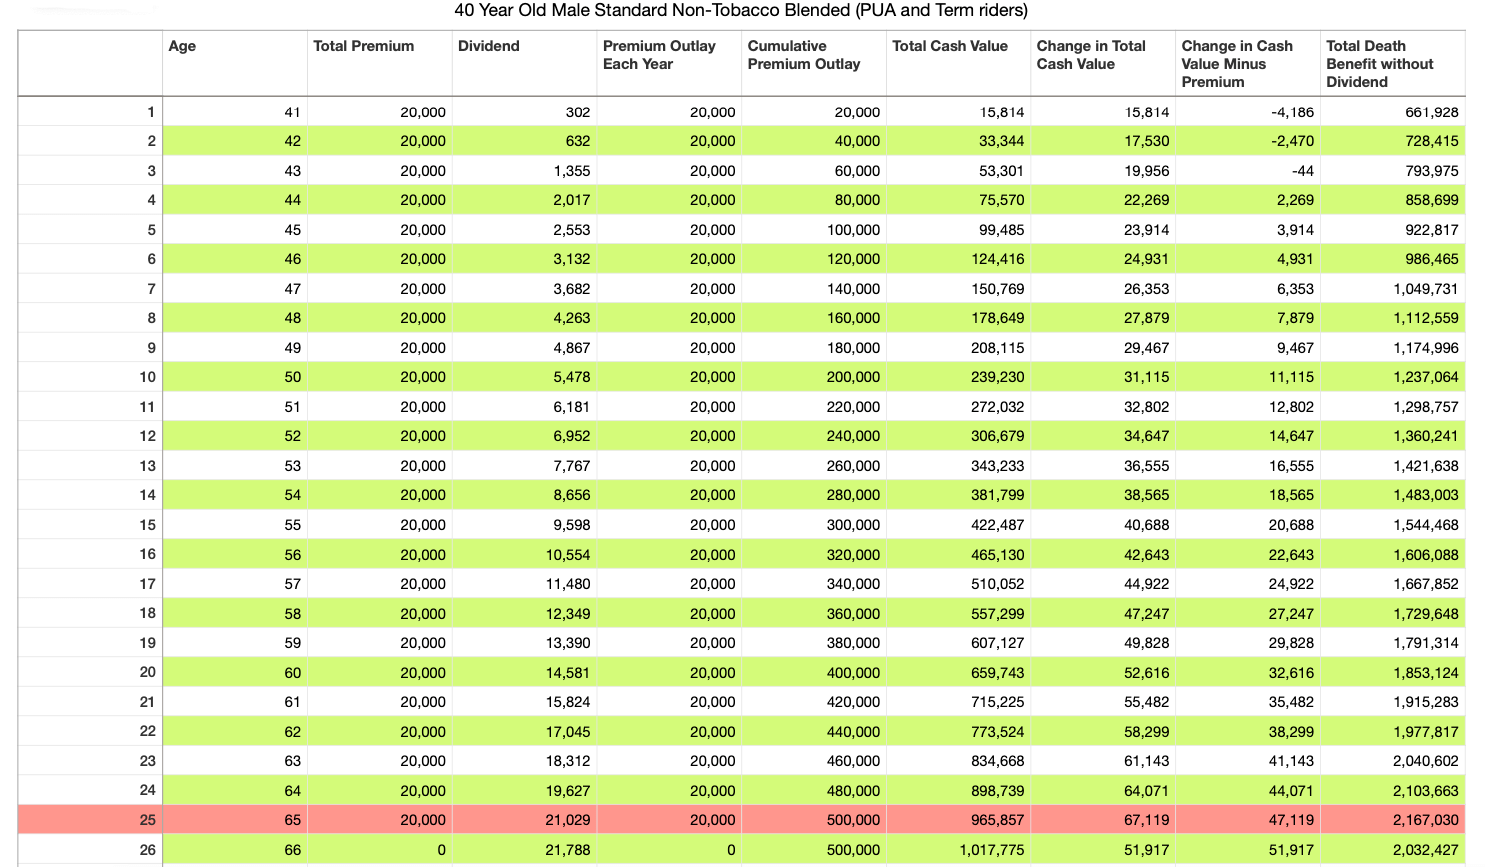
And finally here’s the last example. It shows a blended whole life insurance design just like the one above but only for a standard health rating. I am showing you this just point out the difference that rating can make in long term policy performance.
Please keep in mind, that a standard rating is not bad…it just means that the insurance company thinks you’re like to live to your life expectancy but your health is not so great that they think you will exceed it.
The overall cash value accumulation of the blended policy at the standard rate is not as great. However, it still exceeds the result of the illustration as shown in the first example of preferred plus rating in a non-blended policy.
Policy design determines the speed of cash value growth
A whole life insurance policy can be designed with maximum efficiency to achieve a rapid build-up of cash value. But it will not happen without working with a competent independent broker, like us, that knows how to set up your policy to achieve these results.
As you can see from these examples that were put together for this post, the difference matters. People who buy whole life insurance policies with a traditional policy design are the ones that later go on the internet to talk about how terrible whole life insurance is and how they were ripped off.
We can certainly understand their frustration. But please know your policy can do very well over time and even do much better in the short term if executed correctly.
Again, if you’d like to work with us, we’d love to talk with you. We set up our client's policies like this every day and we work with people from all over the country—use our contact form to reach out or if you’re ready to get into the details, use this form to tell us more about yourself.