

Podcast: Play in new window | Download
In 2013, we published our first historical whole life dividend analysis. We were the first website to go beyond just a basic table of dividend data because we knew the typical table wasn't enough to make any meaningful observation about dividend data.
This year, we are updating the analysis process to introduce more advanced and precise reporting on the data, as well as some predictive methods to provide more meaningful observations about upcoming dividend announcements.
The 2020 Whole Life Dividend Analysis Methodology
We continue to take publicly reported whole life dividend interest rate data and put it through an array of computations to make actionable statements about the activity at various life insurance companies. In the past, the analysis focused on average movement in the dividend interest rate over a 10 year time period and the standard deviation of each company's dividend interest rate.
We are dropping the average movement in the dividend interest rate for the entire 10 year period because I always felt it was a weak computation. It was simply the average change in the first observable year to the last observable year. A crude and okay measurement, but one that lacked any precision that permitted the ability to make further inferences with the data.
We replaced this average movement with the average year-over-year movement in the dividend interest rate (i.e. a linear regression or progression) in the data. This more meaningful measurement of the data allows us to make some predictions about what might happen to the dividend interest rate at any given insurance company (more on that later).
The standard deviation analysis is the same. We use the same data set used to compute the new year-over-year average change to also compute the standard deviation in the dividend interest rate at a specific company.
What Dividend Interest Rates Tell us, and what they Don't Tell us
The dividend interest rate tells us the input variable for the dividend calculation at a specific insurance company. This specific variable deals with the portion of the dividend comprised of investment income generated by the life insurer. This data point is non-standardized, so we cannot compare the dividend interest rate at one life insurer to the dividend interest rate of another and make any meaningful observations.
In other words, we cannot compare a 6.5% dividend interest rate at life insurance company A to a 5.85% dividend interest rate at insurance company B. While many unskilled agents have incorrectly done this and made statements like, “the dividend interest rate at company A is higher so it's better than insurance company B,” the truth is we do not know this to be absolutely true.
What we can meaningfully state is that if the dividend interest rate at insurance company A is 6.5% this year and then 6.1% next year the dividend interest rate at insurance company A went down. We can therefore use the dividend interest rate at a specific insurance company and observe its year-over-year change to get a relative sense of how this component of the dividend changed over time.
Also, the investment income component of the dividend at most whole life companies produces the largest impact on the payable dividend–so following the dividend interest rate can prove important.
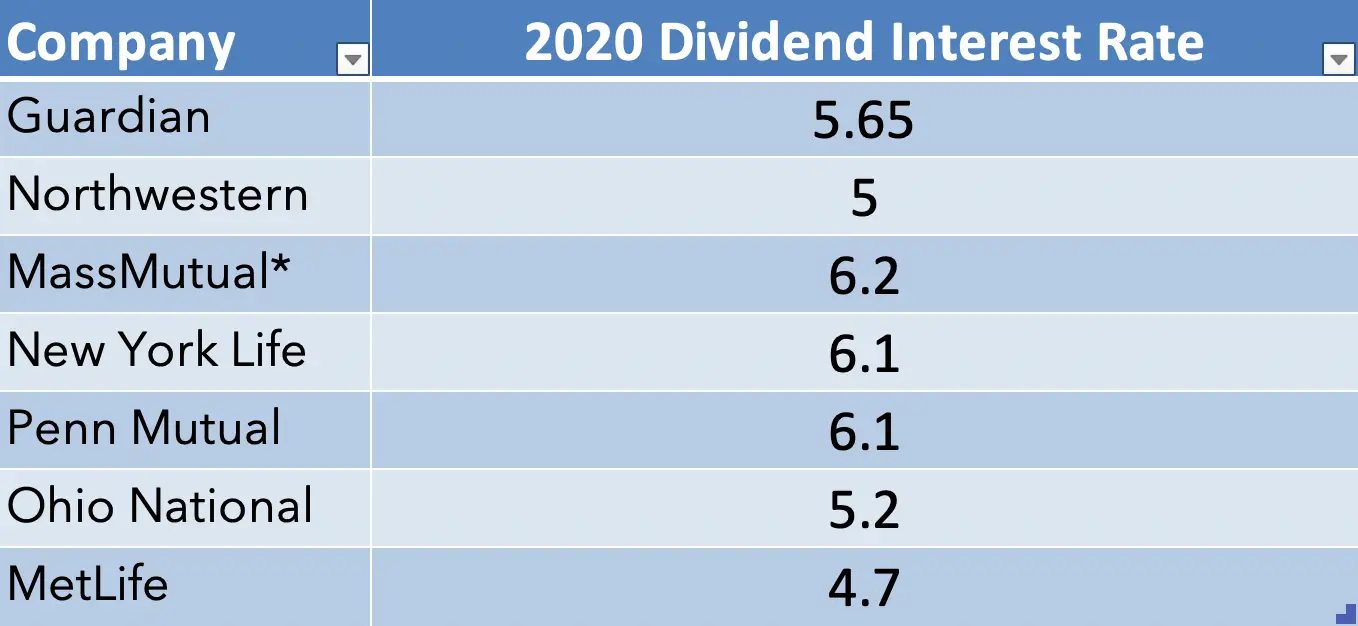
For reference, here are the current 2020 dividend interest rates:
Average Year-Over-Year Dividend Interest Rate Changes
As I mentioned above, the new calculation for average movement in the dividend interest rate is a year-over-year average rather than a simply beginning of the time period to the end of the time period average rate change. This tells us what the average change in the dividend interest rate was for each year during the past 10 years.
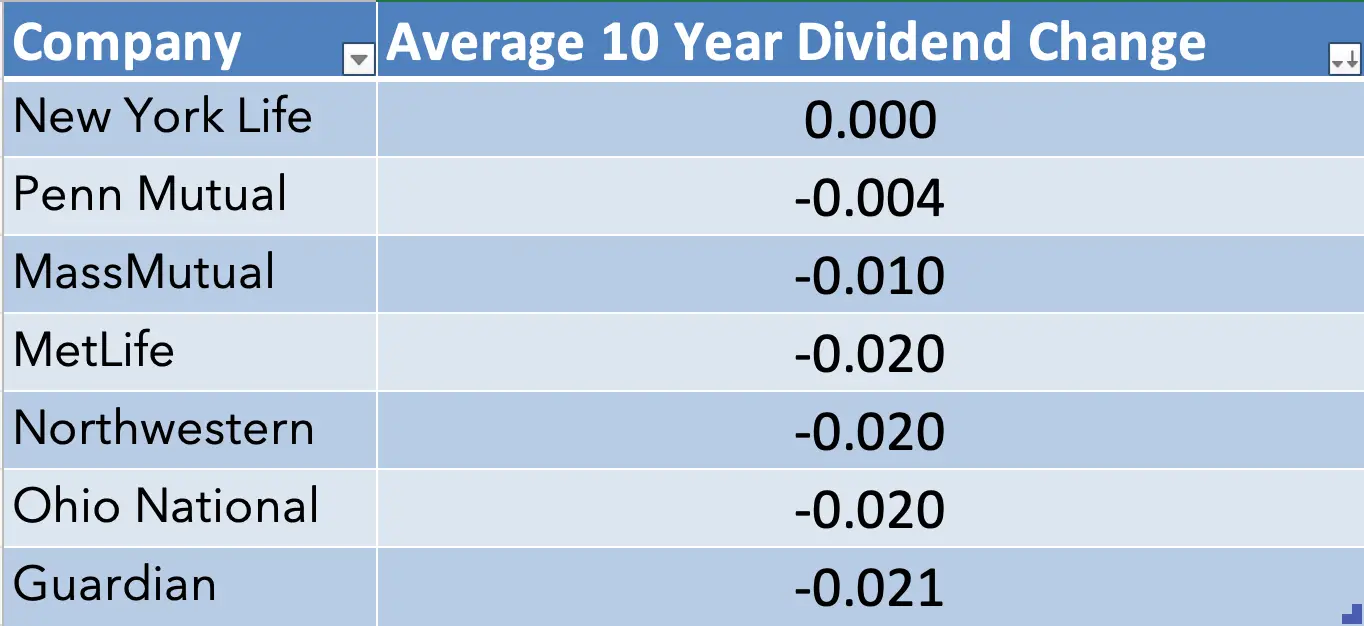
The table ranks companies from the lowest average year-over-year change to highest. While the table states no average change at New York Life, there was an extremely small change that rounds to zero going out three decimal points.
Interestingly, four of the Companies, MetLife, Northwestern Mutual, Ohio National, and Guardian all sort of clump together. MassMutual sits in the middle by itself. New York Life and Penn Mutual gather rather closely with very little movement in the dividend interest rate over the past 10 years.
It's important to note that this data reports on the average change as a percentage change. This is not the average decimal change in the dividend interest rate. In other words, this does not tell us that the average change at Guardian has been 0.021 of its dividend interest rate, but rather the rate of change was on average 0.021 or 2.1% year-over-year.
Standard Deviation in Dividend Rates
The standard deviation analysis proves useful as a way to evaluate the overall volatility of the dividend interest rate. Higher values show us more movement in the dividend rate over the 10 year period; lower rates show us less movement.
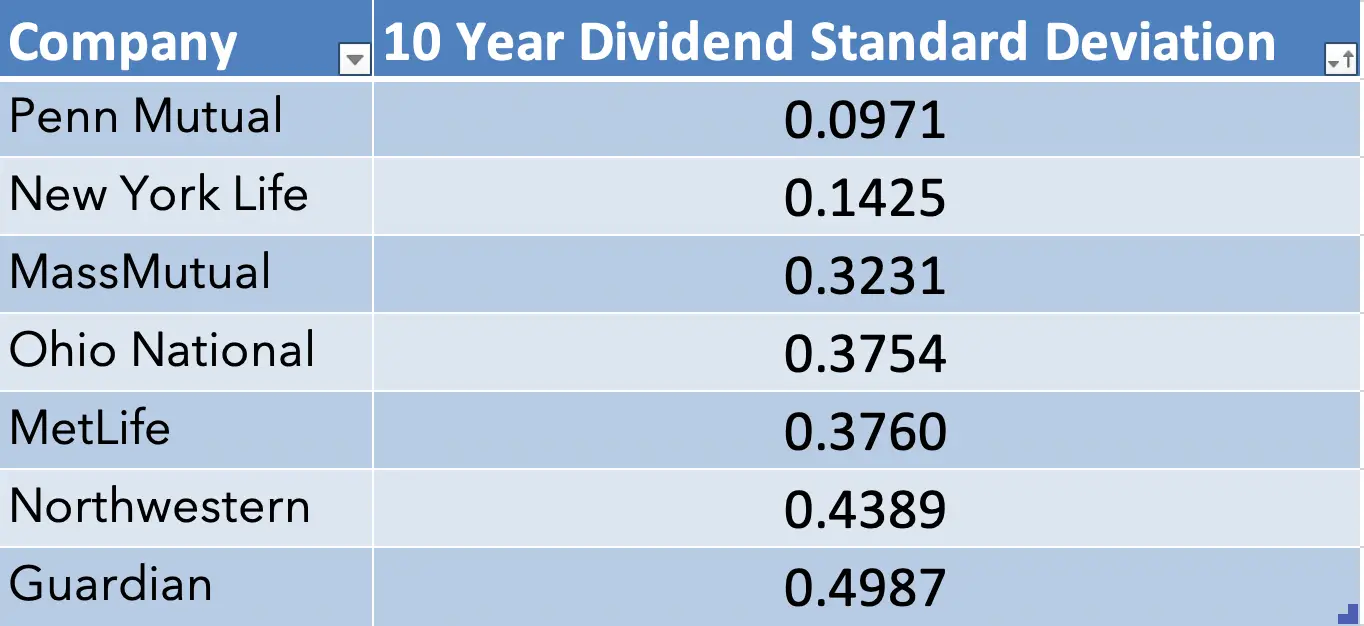
There's an interesting wrinkle in the numbers to highlight here. Despite New York Life's lower average change in the dividend interest rate (coming in at practically zero), Penn Mutual shows far less volatility in the dividend rate in the same time period. This means the New York Life dividend moved around a lot but ended up more or less at the same rate it was at by the end of the 10 year period.
Penn Mutual, on the other hand, moved very rarely but did end up moving to a new (lower) point by the end of the 10 year period.
Again we see a clustering of companies by deviation with MassMutual, Ohio National, and MetLife all falling somewhat close together in the 0.30 percent range while Northwestern Mutual and Guardian fall within the 0.40 range.
This data does report on the decimal change in the dividend interest rate. So for example the 0.1425 standard deviation at New York Life does mean it varied by roughly 14 basis points in the dividend interest rate throughout the 10 year period.
Predicting Future Dividend Movements
We can use the data we have to make predictions on dividend movements in the future. These predictions are not finely honed models based on an array of data to which we have access. Instead, they provide us with a range of potential dividend changes that we can consider “normal” given the dividend activity at a specific company over the past 10 years.
We compute this by using the average year-over-year change in the dividend interest rate and the standard deviation to arrive at a new rate minimum bound.
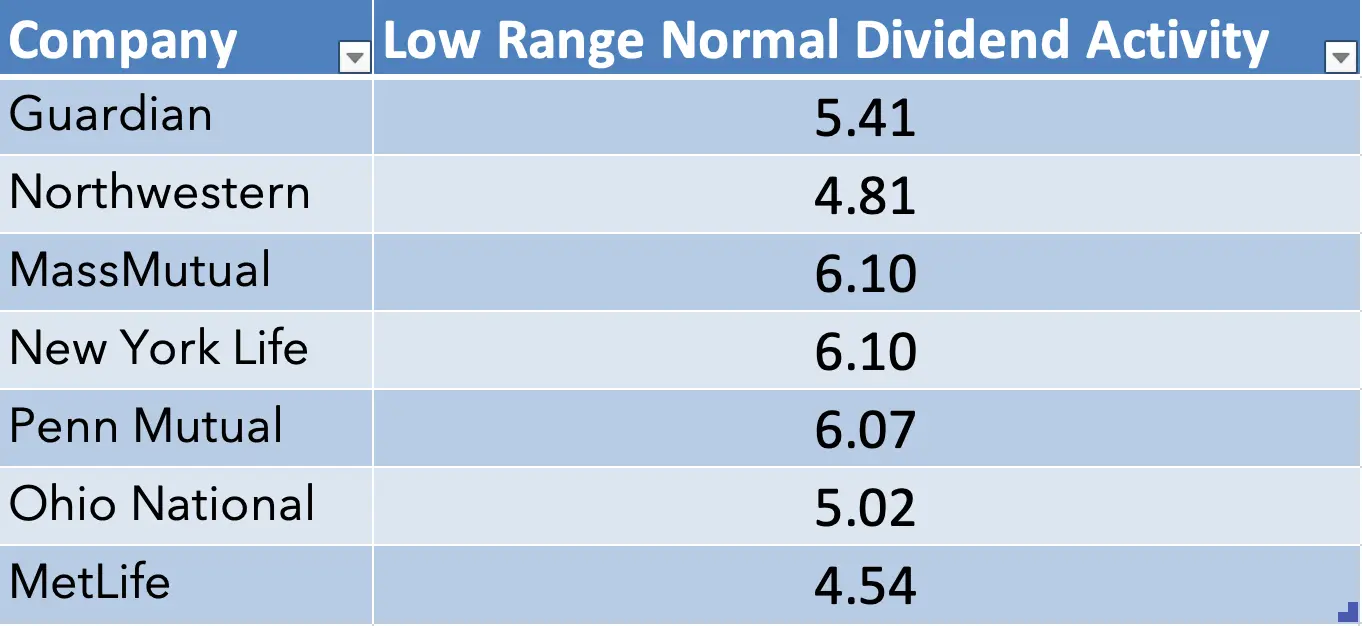
This data shows us the lower limit that each company can drop its dividend interest rates to and remain within a range that we consider a continuation of the trend over the past 10 years.
So for example, if Guardian announces this year that the dividend interest rate for 2021 will be 5.45%, that falls within the range (with 5.41% being the limit of that range) so we wouldn't immediately suspect any harsher negative pressure on Guardian concerning its dividend interest rate. If, however, Guardian announced a new dividend rate of 5.35%, that does fall outside of the range and we'd suspect Guardian faces mounting downward pressure on its dividend rate.
A word of caution concerning this data especially related to New York Life and Penn Mutual. Because current economic conditions facing insurers pose a challenge to sustained dividend rates, and because these two have performed well above average, an announcement from either company to a rate below these figures doesn't necessarily mean either company is in serious trouble. The fact that conditions worsened for either one could be quite literal. Still, we'd prefer an announcement within this range; that's always good news.
Another interpretation of this data is the relative distance between these figures and the current dividend interest rate. The higher this number becomes, the more volatility the dividend interest rate experienced in the past 10 years. Taking Penn Mutual and Guardian as examples of opposite ends of the data set.
If Penn Mutual announces a rate of more than four basis points below its current dividend interest rate, it will fall outside the range of its trend for the past 10 years. Guardian on the other hand can drop its dividend rate by 24 basis points and remain within the normal range for the past 10-year trend.
Dividend Rate is Not the Full Story
Every year we publish a new dividend analysis, we comment on the fact that dividends and dividend rates do not always tell us the full story as it relates to reasons to buy whole life insurance. That fact remains unchanged. While this information is useful for some applications of life insurance buying decisions–chief among them anyone who seeks out whole life insurance primarily for its cash building features for later use–it's not always the most critical factor.
In addition, if you own a whole life policy from a company that performs on the lower end of this analysis, that does not necessarily mean you need to take immediate action on the policy. There are a few reasons why that may not make sense, but I'll leave that discussion for another day.