

Podcast: Play in new window | Download
A couple of weeks ago, we addressed a suggestion that whole life focused insurers are more conservative investors who seek out specifically guarantees when they make their investment decisions. We tested this theory with a comparison looking at the investment profiles of Northwestern Mutual (the number one issuer of whole life insurance in the United States) and Pacific Life (the number one issuer of indexed universal life insurance in the United States).
There was no significant difference between the two insurers' investment profiles. Northwestern did not have a more conservative or higher guaranteed seeking investment profile. In fact, PacLife had less overall exposure to non-investment grade bonds, a longer average bond duration, and a larger percentage of bonds comprising its investment portfolio.
But that was merely a comparison between two life insurers. What if we extended the analysis to several more whole life focused and universal life focused life insurers? What then happens to the results?
Comparing Whole Life and Universal Life Focused Insurance Companies
We made two pools of insurance companies. A whole life insurance focused pool and an indexed universal life insurance pool. Each pool consists of 12 life insurers. Each pool represents roughly the same amount of managed assets for fixed insurance products (just under $800 billion for each pool). The life insurance companies included are:
Whole Life Pool
- Northwestern Mutual
- Guardian Life
- MassMutual
- New York Life
- Ohio National
- Mutual Trust Life
- Lafayette Life
- American United Life (One America)
- Savings Bank Life Insurance of Massachusetts
- Penn Mutual
- Security Mutual
- Thrivent
Indexed Universal Life Pool
- Allianz
- Securian (Minnesota Life)
- John Hancock
- Pacific Life
- Lincoln National
- American General
- Midland National
- North American Company for Life and Health
- Equitable (Axa)
- Transamerica
- Life of the Southwest
- Penn Insurance and Annuity
While there is some overlap in the companies, we did our best to separate companies by majority product focus. Penn Mutual shows up seemingly in both pools, but the company issues its whole life and indexed universal life products through two different companies, so we accordingly categorized those companies.
We used the same criteria in our analysis that we used when we originally compared Northwestern and Pacific Life. We also added one additional metric to compare the pools. The six areas of focus are:
- Portfolio Breakdown
- Non-investment Grade Bond Exposure
- Overall Bond Quality
- Overall Bond Quality
- Average Investment Yield
- Investment Income to Contract Obligations Ratio
All financial data comes from year-end 2019 statutory accounting reports filed by each life insurer and independently audited as part of the reporting process established for life insurers by the National Association of Insurance Commissioners.
Portfolio Breakdown
The portfolio breakdown segments each life insurers assets into seven categories:
- Bonds
- Stocks
- Mortgages
- Real Estate
- Policy Loans
- Cash
- Schedule BA
Bonds, stocks, and real estate are probably fairly self-explanatory. Mortgages can include various consortiums of debt instruments that include some sort of real estate collateral. Usually, mortgage investments for life insurers are commercial mortgages, but they aren't exclusively commercial mortgages.
Policy loans represent the aggregate value of outstanding loans taken by policyholders. Life insurers collect interest on these loans which represent income from the asset. Cash represents cash deposits and bonds that mature in a year or less. Schedule BA is what we normally think of as alternative investments like hedge funds and private placements (to name a few examples).
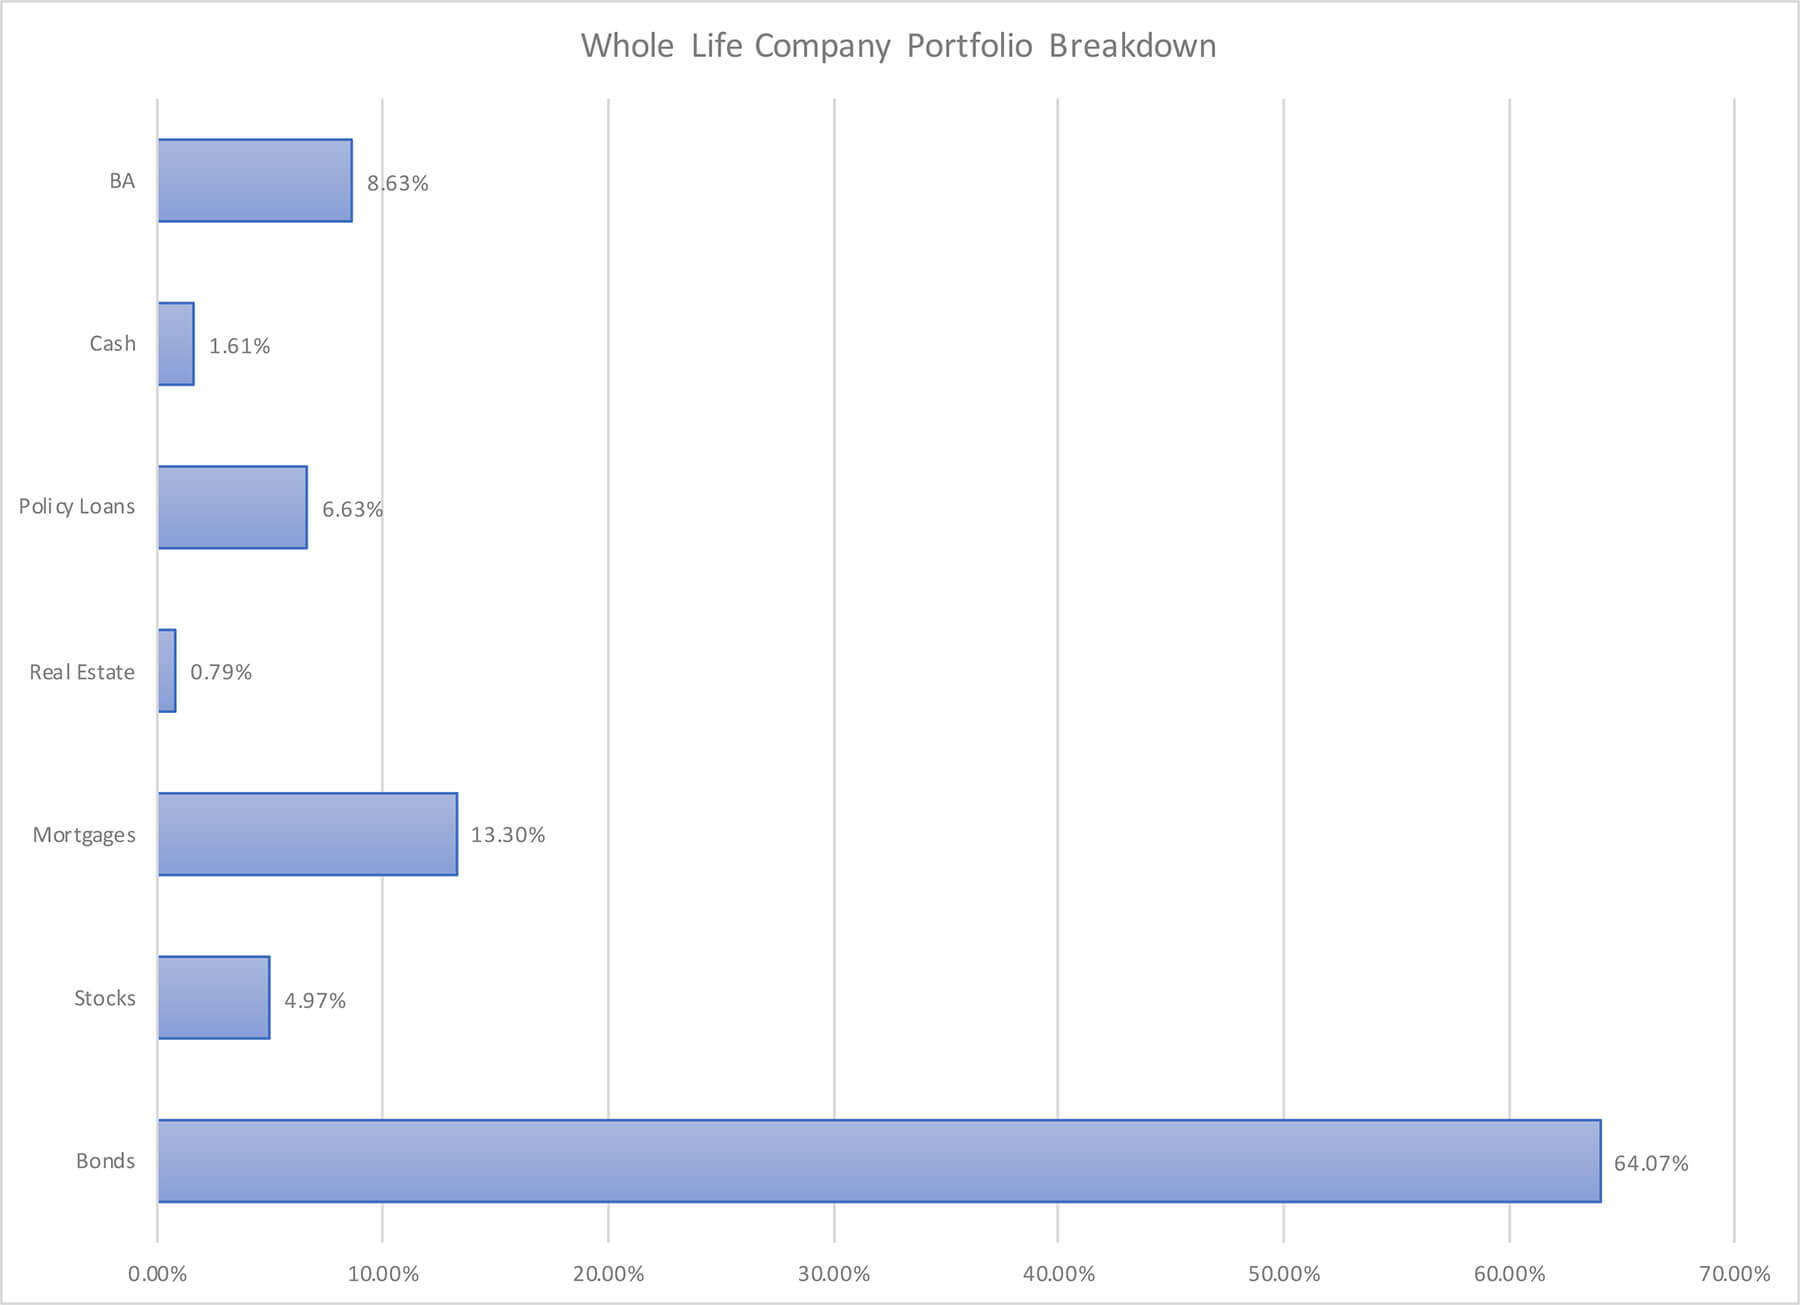
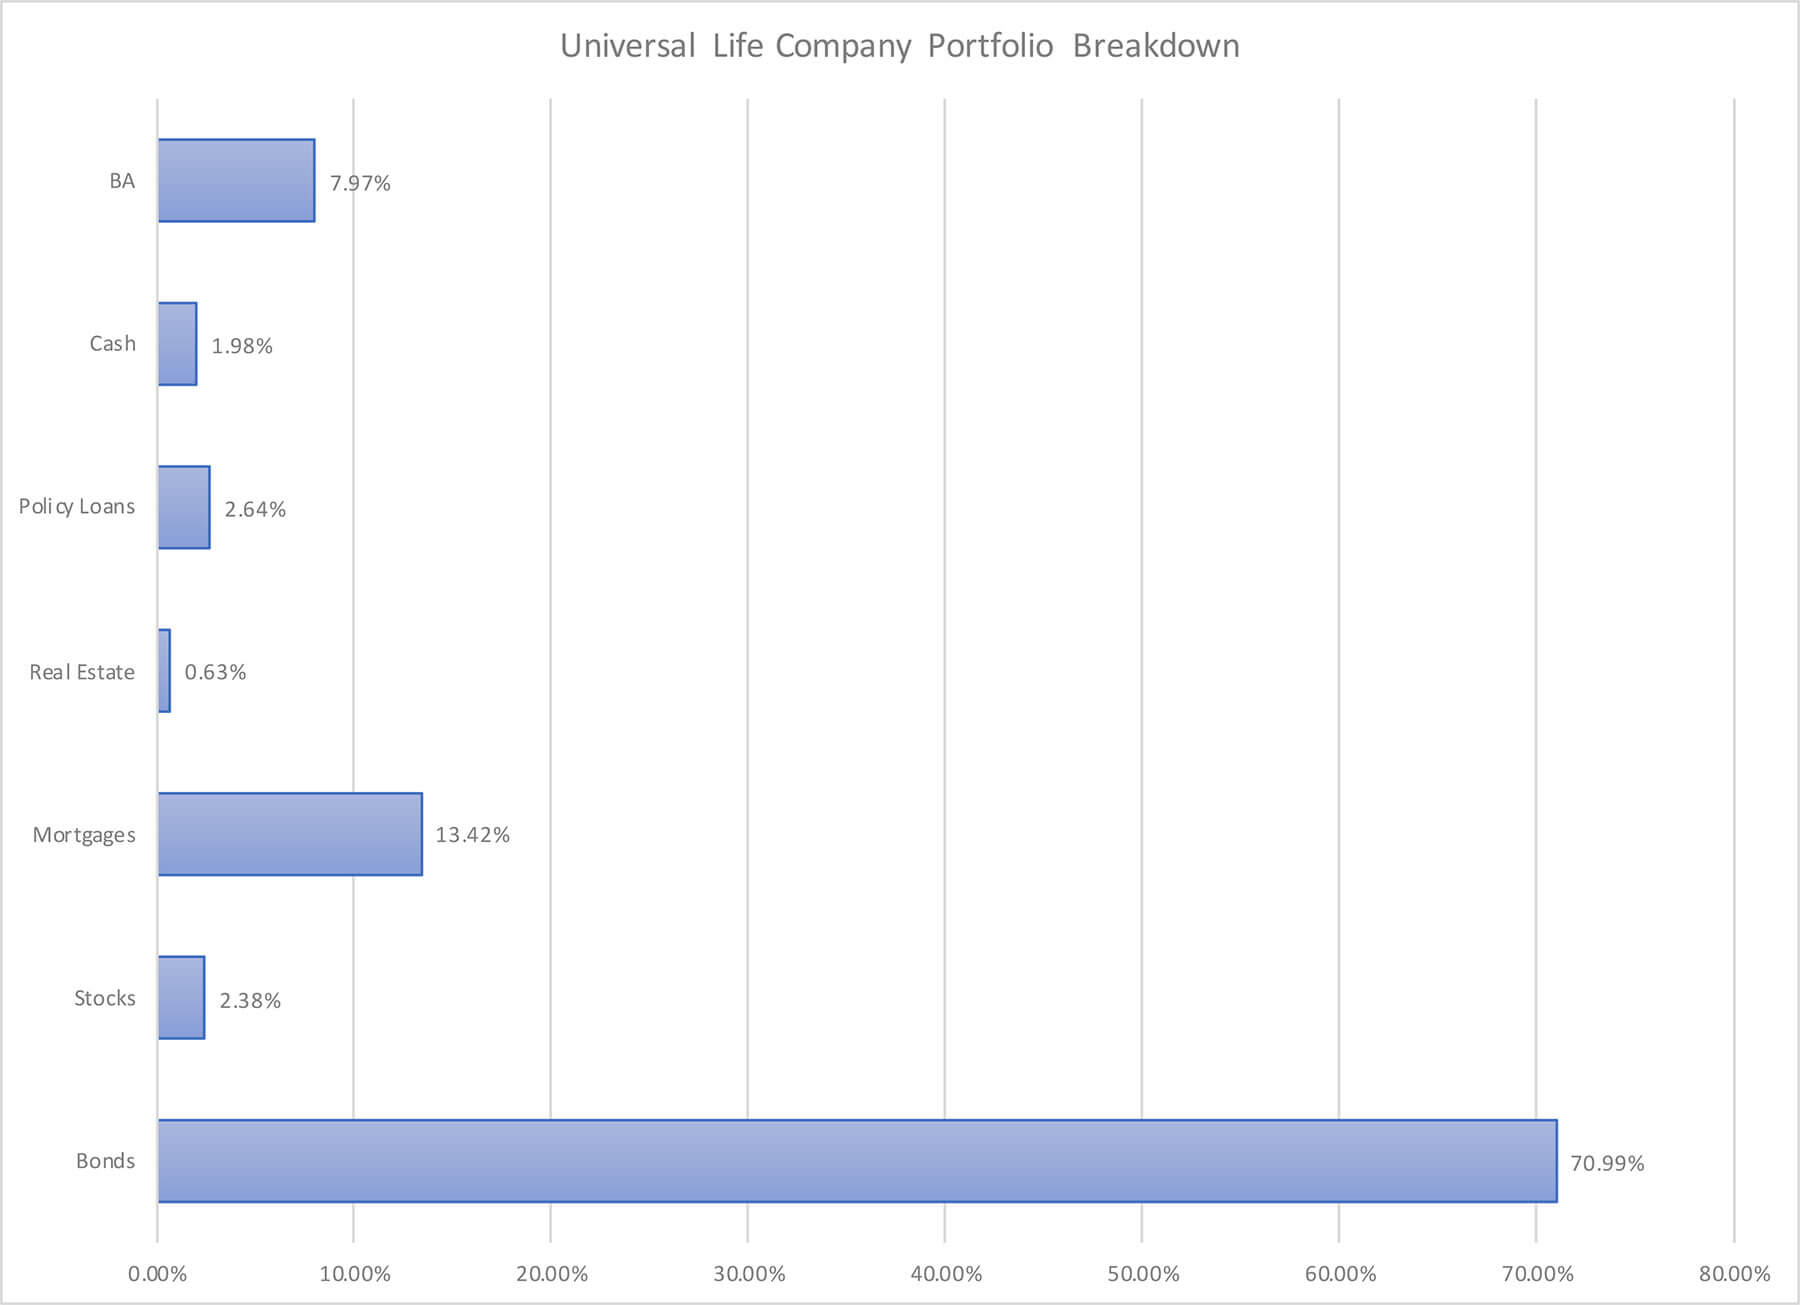
There are some very small variations, but the overall trend is identical. Bonds are the largest (no surprise), mortgages are second-largest, schedule BA is third largest. Over the past 10 years, mortgages and Schedule BA grew in terms of the percentage they comprise for many life insurer's general accounts. Continuously low-interest rates are the primary driver behind this trend. Insurers moved to these assets to try and recover some of the lower yields they now face with new bond issues.
It is interesting that universal life companies have a much smaller overall exposure to policy loans. We suspect this might be in part due to the likely larger annuity exposure these companies have versus the whole life companies. Annuities rarely have policy loan provisions, so that could explain some of the lower overall policy loan exposure. This doesn't mean that the whole life companies don't have annuity exposure. Many of them have subsidiary life insurance companies that issue and manage their annuity blocks. Those subsidiaries were not included as part of the financial data for the whole life pool.
It's also a little interesting that the whole life pool has double the number of stocks compared to the universal life pool. Holdings in stocks have fallen considerably in the past 10 years among life insurers.
Non-Investment Grade Bond Exposure
All bonds held by a life insurer receive a bond quality rating. The National Association of Insurance Commissioners (NAIC) sets the criteria for the bond quality ratings. Bonds fall into six categories 1 being the highest quality and 6 being the lowest quality. Categories 1 and 2 are investment grade and all other categories fall into non-investment grading.
It's important to understand that the NAIC's definition for non-investment grade bonds is not the same as the junk bond designation the investment industry uses. NAIC non-investment grade bonds 3 and 4 are certainly higher risk, but they would not receive junk classification by normal bond investors.
Neither pool had any considerable exposure to bond categories 5 and 6.
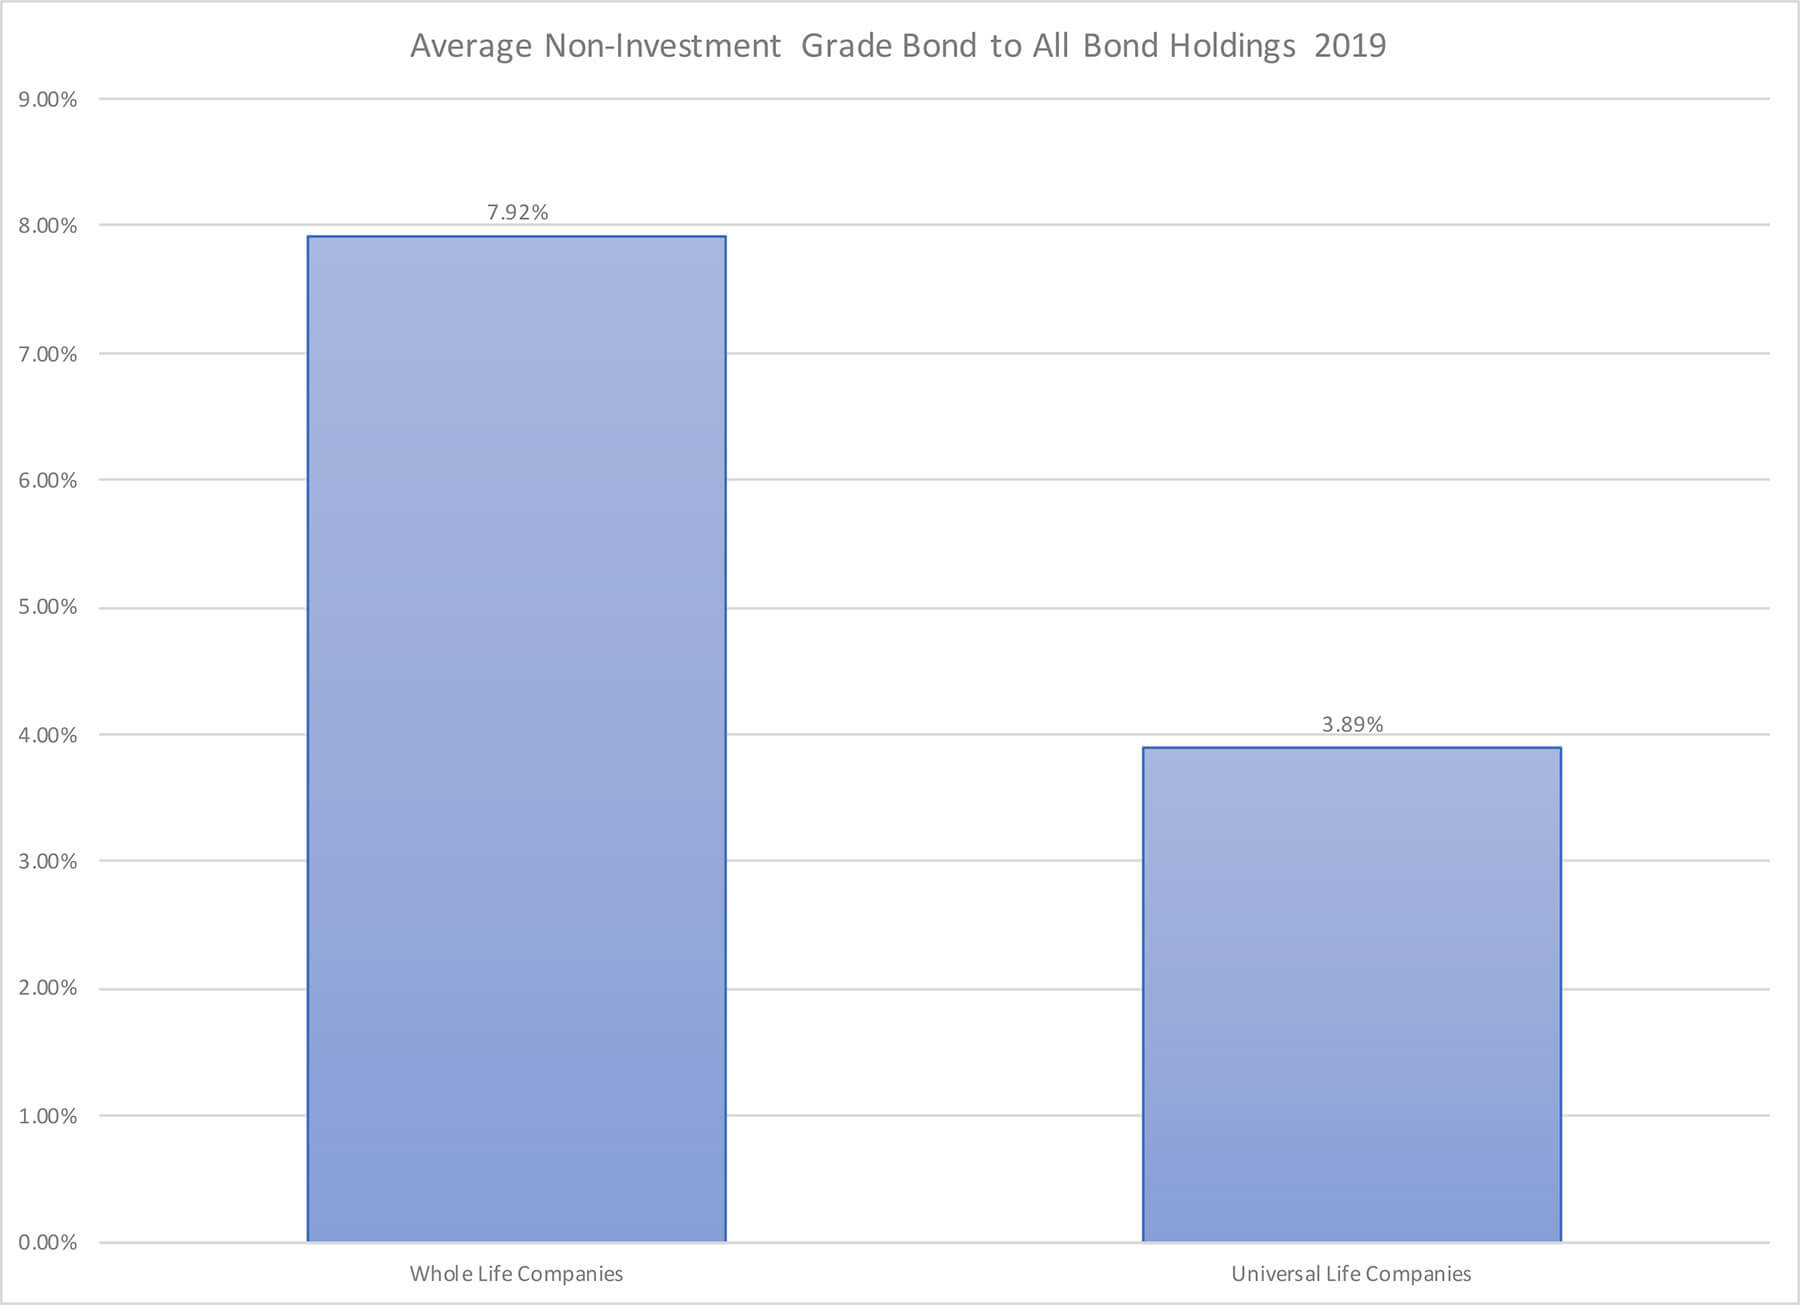
Whole life companies do have a considerably higher exposure to non-investment grade bonds. As we already covered, these are not junk bonds in the traditional bond investor sense. They are increased risk of default bonds that the NAIC classified under its special criteria.
Bond Quality
Bond quality uses the category rankings established by the NAIC and the percentage each insurer has in each category to compute a weighted average.

Despite the higher non-investment grade exposure among whole life companies, overall bond quality weighted averages are nearly the same. This suggests whole life companies do hold a higher degree of highest quality rated bonds, while universal life companies appear to have more second-highest-rated bonds.
Bond Duration
Looking at the overall bond held by all insurers, we calculated the average duration of bonds held in each pool.
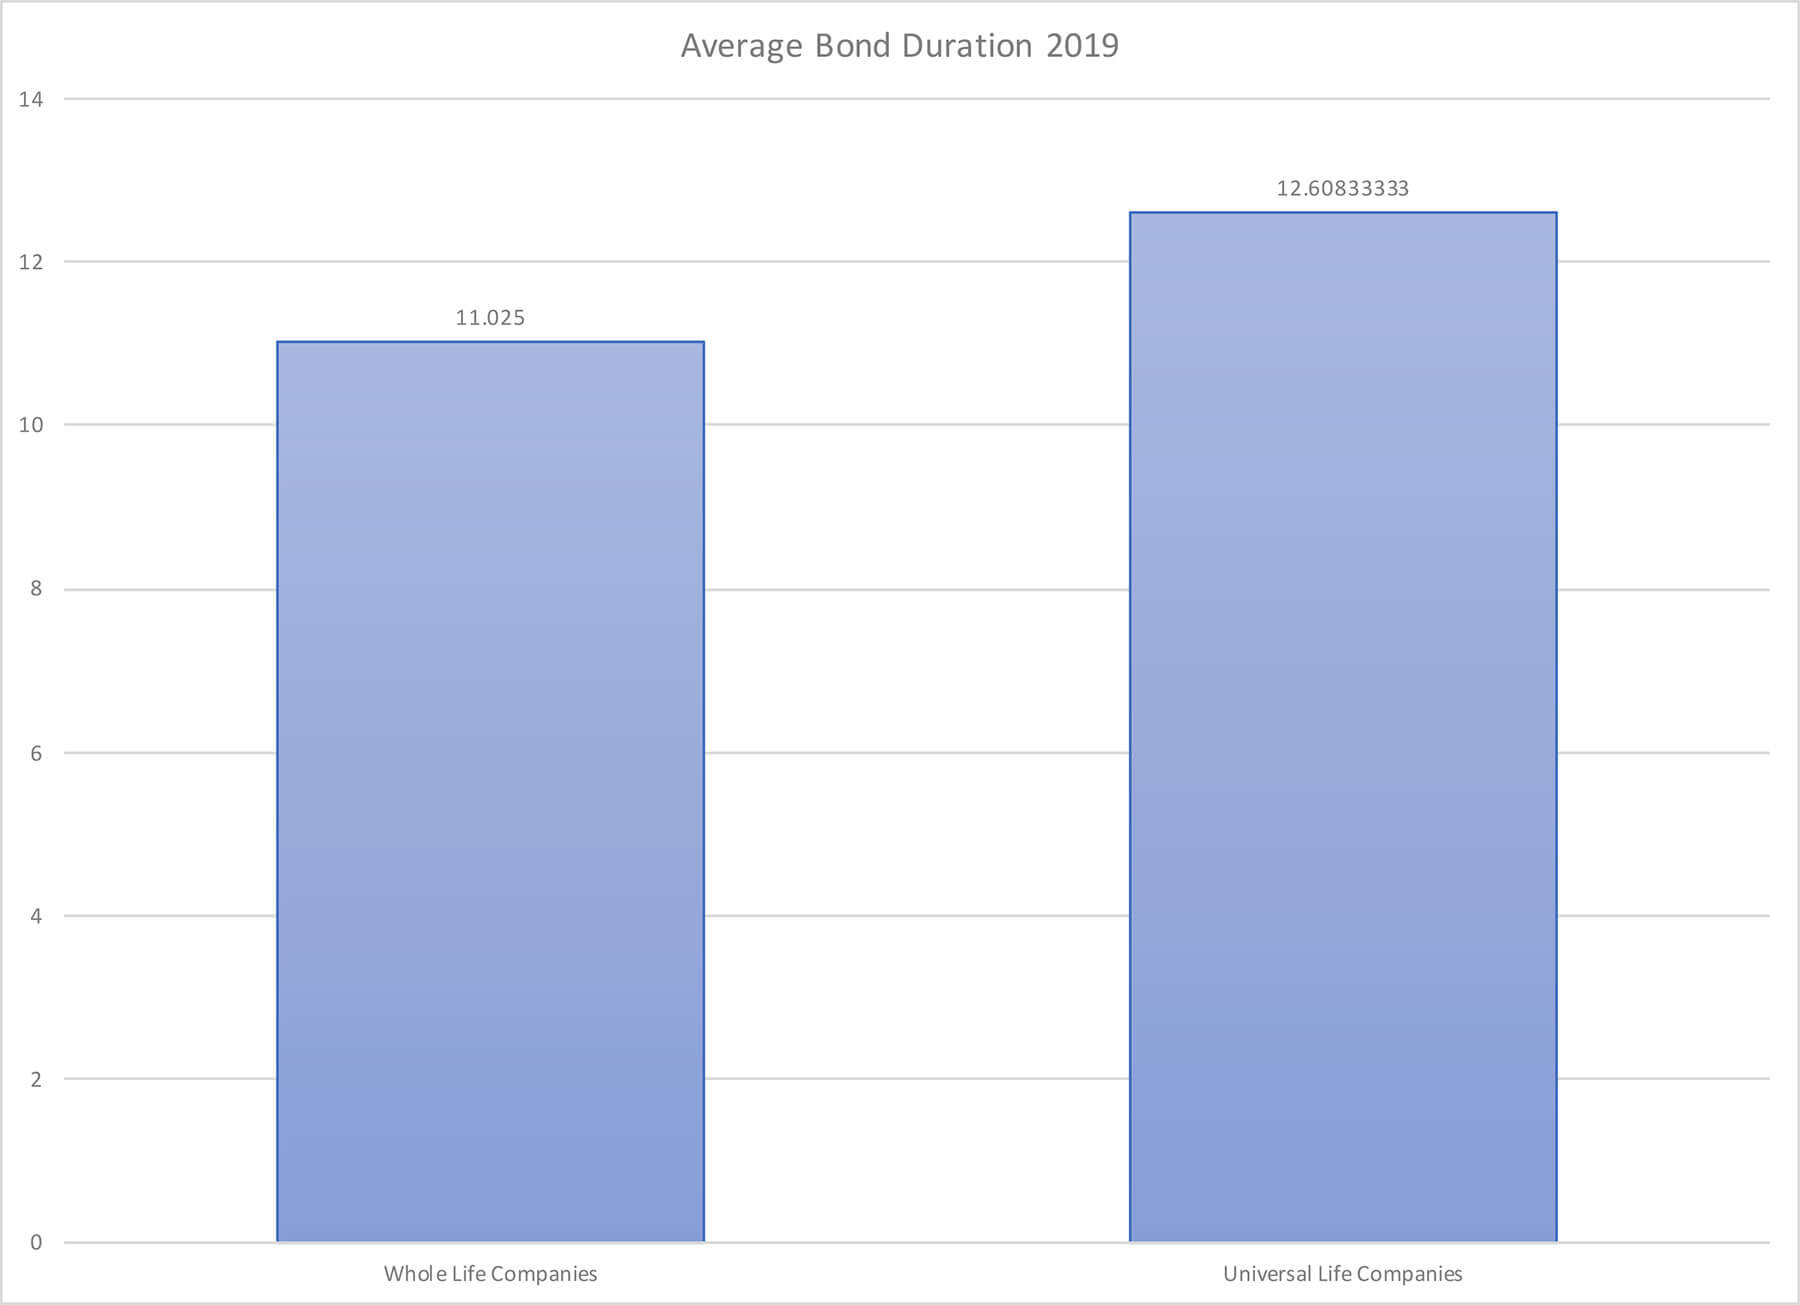
Universal life companies have a slightly longer average bond duration. This doesn't likely give them any real advantage over whole life companies given that the average is only approximately 1.5 years longer.
Investment Yield on Assets
Investment yield on assets is the effective yield each insurer achieved on its assets held for fixed life insurance products.
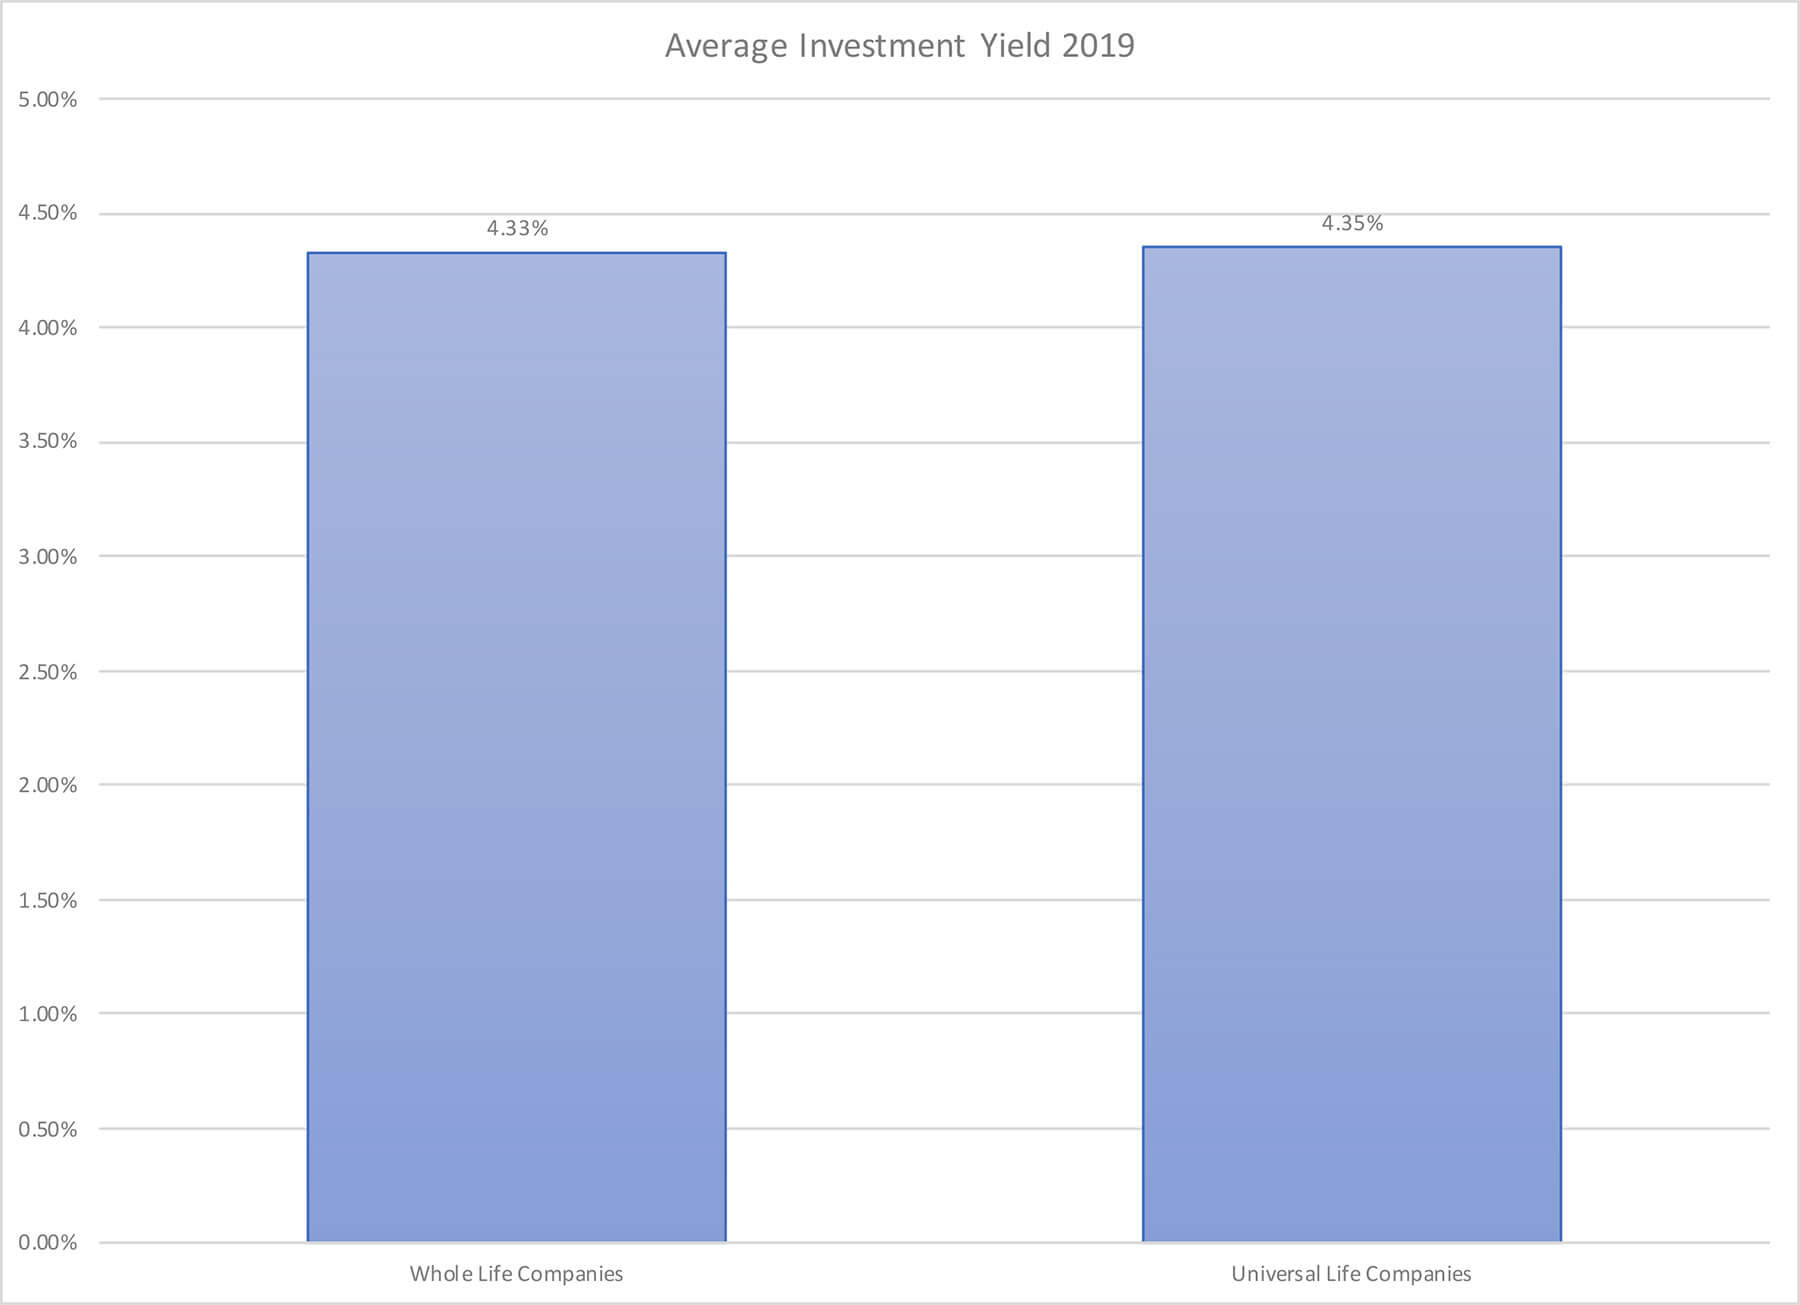
Despite the slight differences in bond quality and duration and small variances in portfolio breakdown, overall asset yield is nearly identical. Both pools of assets were roughly the same size, meaning that overall investment income is approximately the same amount of dollars between both pools.
Investment Income to Contract Obligations Ratio
Investment income compared to contract obligations looks at how well insurers generate investment income with their assets in excess of obligations created by the insurance contracts they issue. Life insurers have long generated profits off the income they derive from assets created by collecting premiums for insurance contracts.
This, of course, works only if the insurer can generate investment income in excess of the contractual obligations they create with the insurance policies they issue.
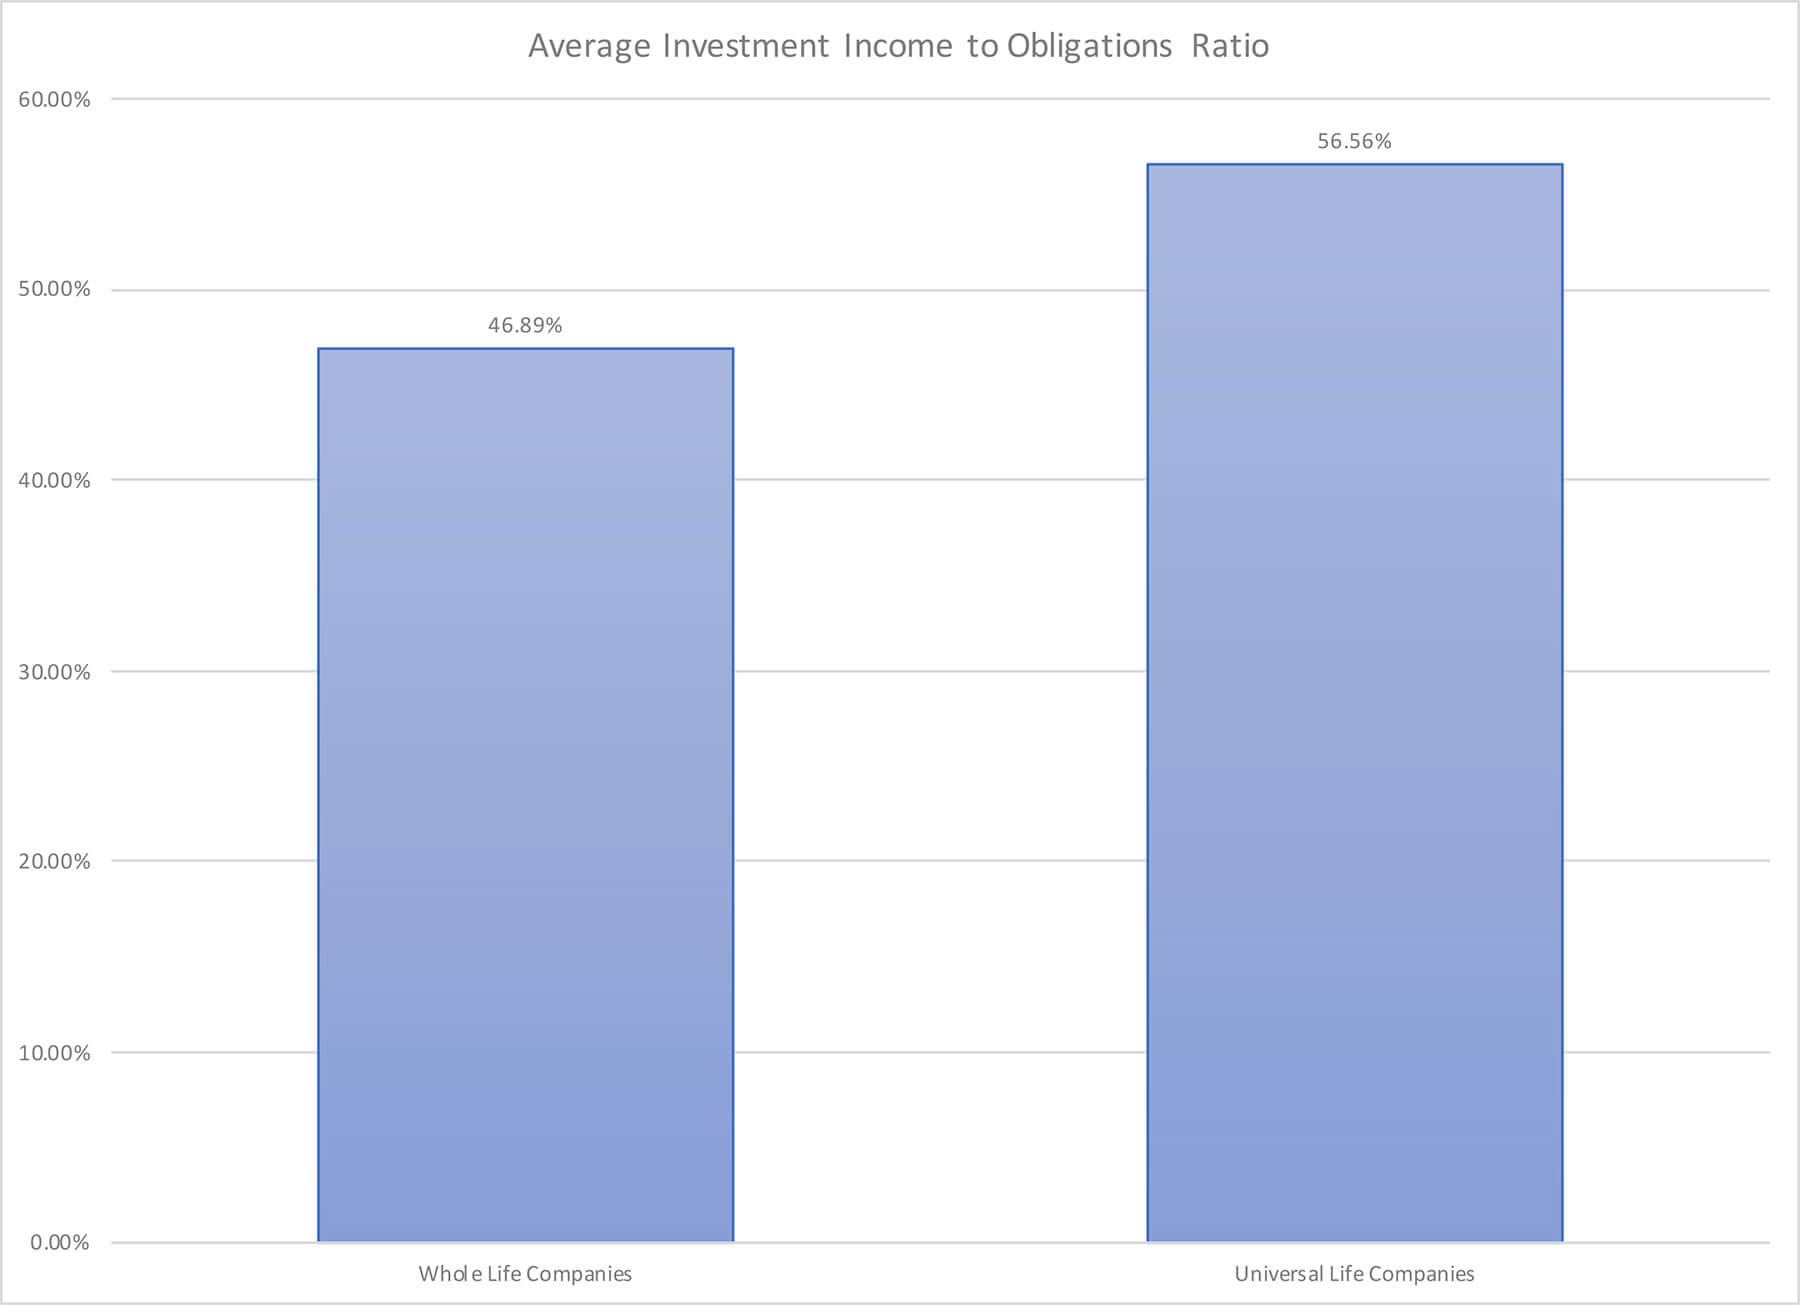
The percentages above represent the income in excess of contractual obligations. Since both pools generated approximated the same amount of dollars, we can conclude that the whole life pool has higher overall obligations. This shouldn't be surprising.
Whole life is well known for its high guaranteed benefits, so we'd expect to see higher obligations represented in this analysis. This, of course, does cause some question about how much of a drag these guarantees have on profitability among whole life focused insurers since they generally produce no better investment results than universal life focused insurers.
Results Similar to Original Analysis
This analysis is much more comprehensive with respect to capturing much more of the market place for whole life insurance and indexed universal life insurance than our original analysis. That said, the results are no more different than the results seen in that original analysis. The hypothesis that whole life focused insurers are more conservative, invest in higher guarantees, or do anything safer investment-wise than universal life focused insurers has no empirical support. In fact, in very minor ways, indexed universal life insurers appear slightly (very slightly) safer than whole life insurers–this is splitting hairs, however, and I wouldn't say there is any meaningful difference.
The one big takeaway from this data is that higher guaranteed contracts do wrap up more operational capital created by investment income. This isn't a new frontier of information. It's pretty well established that higher guarantee contracts restrict insurer options' as they must capitalize to meet those guarantees.
It's a chief reason why many insurers left whole life insurance years ago. The chances that this higher obligation to policyholders places whole life focused insurers at a serious disadvantage remains to be seen and also has no empirical support.