

You can find the latest Whole Life Insurance Dividend Analysis Here
Since 2013, we have published the only public analysis on variation in dividends for major participating whole life insurance products. This analysis is a better gauge on product dividend performance than traditional reporting that focuses on the absolute declared dividend announced by each company.
We have long argued that our analysis is superior because of the critical role variation over time plays in our approach. Rather than allowing a singular good or bad year influence perceived value, we use the rate of change in dividends over time to compare dividend actions taken across life insurers.
This is preferable because there is no standardized reporting method used in the life insurance industry for dividend scales. Mathematically we do not have a coefficient for the dividend variable, so the raw numbers reported by insurers are meaningless when compared to one another.
We can, however, use changes in the variable (declared dividend rate) to make meaningful inferences about the superiority or inferiority of one company’s dividend performance vs. another over a period of time.
The information taken from this analysis in broad in scope, which means we can only identify large trends and not superfine explanations regarding actions taken at one company or another. This broad trend, however, is very useful for our purposes.
Why the Dividend is so Important
We use whole life insurance to build wealth. This wealth is no so much focused on the death benefit that will eventually be left to the heirs of the insured under the policy. Instead it is focused on the buildup of cash value inside the whole life insurance policy.
All whole life policies have a set of guarantees with respect to the buildup of cash value, but this guarantee is mostly uninspiring in its purest sense. The reward of dividends paid to policyholders through the legal promise mutual insurers have is the key driver behind this strategy as one for wealth creation.
To put it another way, better dividends create more wealth through policy cash value buildup and we want to speculate on where the best dividends can be earned.
Methodology
We measure the standard deviation and compound annual growth rate of seven top life insurers using their declared dividend rates over the most recent 10-year period.
We look at these two metrics for the following reasons:
Standard Deviation
We use standard deviation as a volatility marker. Has the dividend rate move sporadically over the 10 year time period, or has the company tended to hold the dividend constant?
A higher standard deviation likely indicates that the dividend has experiences sharper movements (either up or down) over the time period than a company with a lower standard deviation.
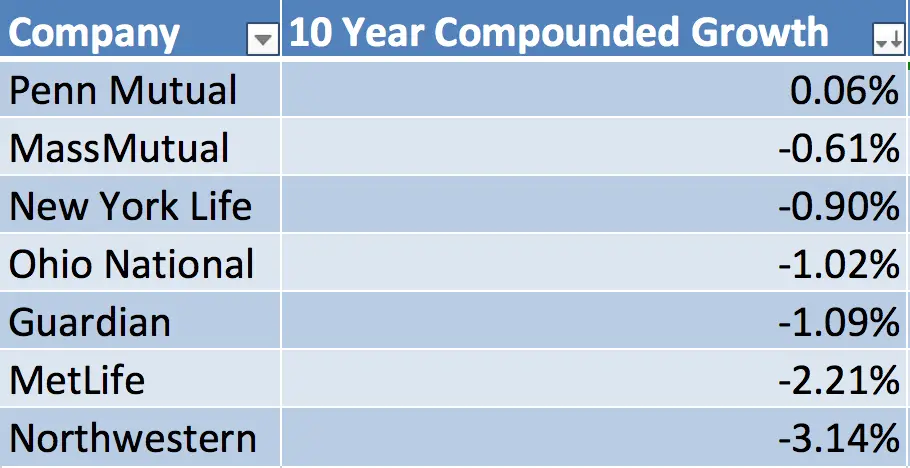
Compound Annual Growth Rate
Compound annual growth rate shows us the change in the dividend rate taking time into account. This means it shows us how much the dividend rate has tended to change year over year for the specified time period (10 years in our example).
The Results
The following two charts depict the results of our analysis:
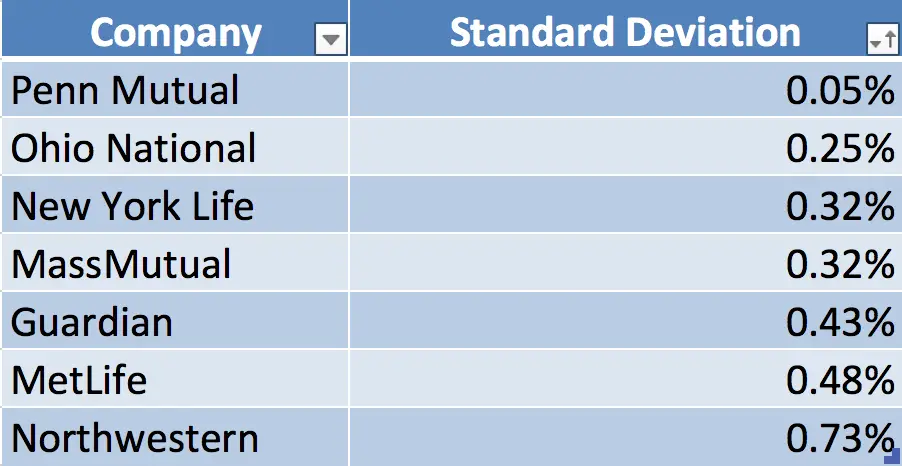
As a group the standard deviation among all insurers remains virtually unchanged versus last year’s analysis.***
Most insurers stayed the same, with Guardian Life being one notable exception. Guardian’s 10 year standard deviation rose (i.e. became more volatile with 2016 data included) by more percentage points than any other company. Countering Guardian’s rise in volatility, Northwestern Mutual’s dividend scale standard deviation declined by the same percentage points—a noteworthy improvement vs. past years’ analyses.
Compound annual growth rate was down considerably for the group vs. last year’s analysis. The average loss year-over-year was around 0.10 percentage points—and that’s considerable given the mechanics at play.
The largest decline vs. last year’s analysis was at Guardian life, the new 10 year CAGR falls 0.37% followed by Northwestern with the 10 year CAGR falls 0.26%.
No company improved CAGR vs. last year’s analysis and only one company maintains a positive CAGR for the 10 year period, Penn Mutual—interestingly, Penn Mutual also had the lowest standard deviation (volatility) over the 10 year period, this observation has played out for several past analyses.
A Few Notes
As we’ve noted in previous analyses this is only one evaluation of multiple possible metrics to review for life insurers. While it is a serious drill down into dividend performance for whole life focused life insurers, it’s not the ultimate comparison for life insurers and whole life insurance purchases.
These results do begin to give insight into possible successes or failures. They can act as a starting point to help one navigate the process of selecting an insurer.