

As we’ve mentioned before, most life insurance agents like to spar about the numbers in a way that seeks to make the particular whole life insurance policy they're pitching seem like the clear winner. But of course the truth of the matter is that how a product currently performs or is illustrated given a present set of assumptions doesn’t much matter.
Well…that might be a slight misstatement.
Not to say that it shouldn’t be a factor but it isn’t all that difficult to manipulate current assumptions to make your product look better than your competition.
Remember the design of a whole life insurance policy is crucial and unfortunately this is where a great many agents falter. Yes, there are some essential, core features that a policy should contain to make it perform as it should when using it to accumulate cash value as an asset but it's the application of those features that matters most.
Many of our readers may recognize this topic as this is an update of a previous post that Brandon wrote last year. There are a great many numbers I could discuss within this particular set of data, however, for our purposes today, I’ll just stick to the discussion of taking income distributions from your whole life insurance policy. This particular tidbit is where the nuance becomes more evident from one life insurer to the next as you will see.
This is a report, compiled annually by Blease. It compares the distributions from a number of different whole life policies, issued by a number of different life insurance companies. We have the most updated report from February 2013 :
Click on the image to open the pdf in a separate window
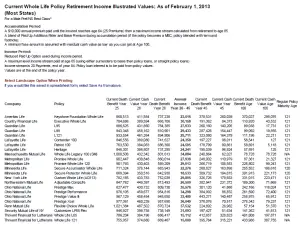
The Assumptions for this report:
- Male Age 40 with a policy issued at whatever the company had as its Best underwriting class
- An annual premium of $10,000 until the insured is 64, a total of 25 premiums
- Maximum level income stream is paid for 20 years (annual payments) from age 65 through age 84
As Brandon mentioned when he discussed this report last year, it’s important to note that the figures on this report are based on projected results. We can't rely on them implicitly to tell us the whole truth, however, there is something important we can gather from studying this sheet.
What can we gather?
The ability to access cash values in the policy by paying very close attention to the projected income distributions as they relate to the total cash value of the policy. This gives us a glimpse into the mechanics of each company's policy. The devil is in the details.
The winners in the 2013 edition (as of February 2013) are Penn Mutual, Ohio National and Mass Mutual. Ironically, Northwestern Mutual, a company that spends considerable time convincing the public they have the best whole life on the planet, doesn't fare too well in this comparison. In fact, they’re somewhere in the mid-lower part of the pack when it comes to income distributions.
Not that I'm trying to single them out or anything, it's just interesting…don't you think?
Let’s dig a little deeper into the numbers.
Much like the numbers from the last report we discussed back in 2012, it seems that among the top three companies Penn Mutual, Ohio National and Mass Mutual, one could access about 7.6+ cents of every dollar in cash surrender value, while Northwestern Mutual only allows about 5.8 cents.
Why is that? Needless to say, it leaves us scratching our heads as it is consistent with what we see from them on a regular basis in competitive situations and it's consistent with the data from last year's report.
What’s the big lesson from looking at these numbers?
The income distribution figures matter. How a particular policy/product is engineered can make it work really well for being used as a retirement income generating tool–as you can very well see by studying the numbers from Penn Mutual, Ohio National and Mass Mutual. Alternatively, you can see how bad engineering and poor policy design can make policy performance lag as in the case of Northwestern Mutual, Thrivent, and Minnesota Life.
Don’t let yourself be taken in by looking only at the cash surrender value of the policy you are being pitched, it’s just a distraction. Ask to see the distribution numbers and compare those figures with competing policies. This will paint a much clearer picture into the mechanics of the product you're being pitched. Remember, the inner workings of the policy matter despite the fact that most agents will try to convince you otherwise. Keep asking questions until you are satisfied with the answers.
Another bit of advice
Consider asking to see income distributions from age 65 all the way out to age 100.
I don’t know about you, but I know quite a few people who have lived and are currently living well past the age of 84 or 85. I’d rather be sure I have enough income during my retirement to last longer than I do. Outliving my income doesn't sound all that appealing.
Using whole life insurance as a tool to generate income in retirement is a viable strategy, just make sure that you evaluate it as such, not solely on the basis of which company creates the bigger pile of cash.
Fantastically deep dive into whole life. Very impressive! Thank you!!!