

I personally take risk adjusted rate of return very seriously. My focus on it largely comes from the notion of taking calculated risks to achieve various levels of return. For example, one might make a killing placing his or her entire life’s savings into a pink sheet stock, but risk exposure relative to the anticipated return is likely extremely unattractive.
One of the elements we find so attractive about life insurance in your portfolio is the stellar risk adjusted rate of return. But how do various life insurers themselves rate when it comes to the return they achieve on their policyholders’ money and the risk they must shoulder to achieve it?
Finding the Metric to Gauge Risk Adjusted Rate of Return
Risk exposure is somewhat subjective without the benefit of hindsight in many cases. Simply looking at the breakdown of assets in terms of broad categories held by an insurer offers little insight into the insurer’s assumed investment risk profile.
Further, looking at an exact breakdown of investment assets is both difficult to obtain and substantial in the task of distilling any meaningful understanding of what risks exactly those assets represent.
Luckily the insurance industry has a regulatory process of quickly summing up potential risk contained in an insurer’s investment portfolio.
The Asset Valuation Reserve
The asset valuation reserve (sometimes referred to as the AVR) is a regulatory component to an insurer's surplus capital holdings. It’s calculated by insurance regulators based on perceived credit default or equity decline risk of the insurance company’s invested assets and represents money that must be held to cushion the risk of asset declines.
Given this fact, it’s a wonderful metric we can use to efficiently make broad assumptions about the overall risk profile of an insurer’s assets. Further, if we look at it as a ratio relative to overall assets, we can use it to compare relative portfolio risk from one insurer to another.
Methodology
Taking the ratio of asset valuation reserve to total statutory assets (total assets minus separate account assets) we can compare how regulators view the relative risk of loss various insurers face.
This information on its own is somewhat interesting given its ability to quickly compare the riskiness of an insurer’s investments. But we can take it further by looking at how insurers compare given their investment results.
Using investment return coupled with the ratio of asset valuation reserve to statutory assets, we can make a broad comparison across life insurers to see how has achieved the best return on assets relative to the risk assumed. To further expand the analysis beyond a single observation, we’ll average the results over a five-year period. This will help remove the impact an extraordinarily good or bad year might have on a single insurer for this comparison.
Our comparison will then rank the insurers based on a score we created by taking the relative distant the insurer has from the mean of the data set. This simple means we summed the number of percentage points the insurer is from the mean of the group to arrive at a score we could use to rank insurers for risk adjusted rate of return.
The Results
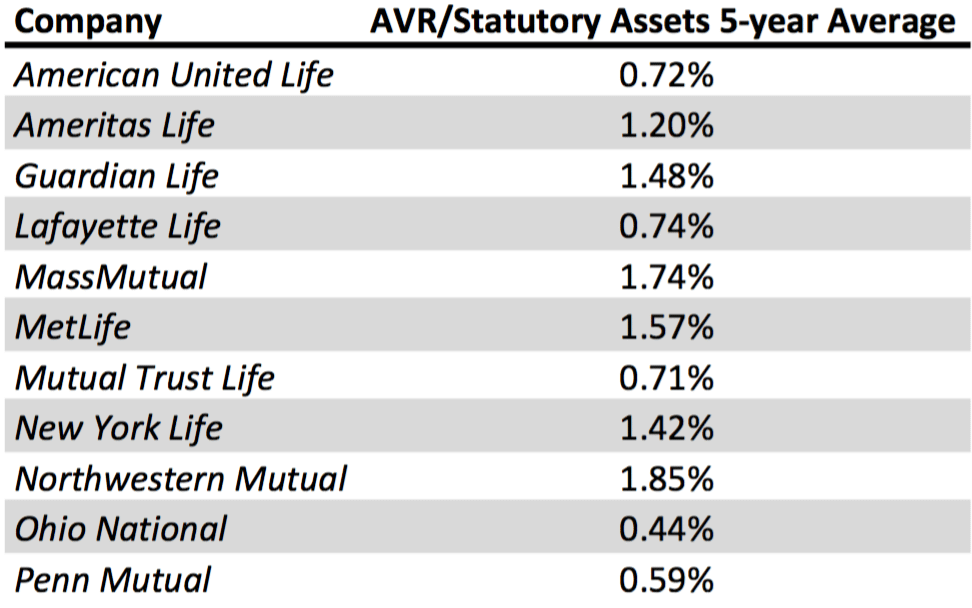
First I’ll show you the five-year average for asset valuation reserve to statutory assets. The order in this table is by alphabetical insurer name. The lower the number, the “better” or less risky a portfolio given the insurer's lower calculated asset valuation reserve.
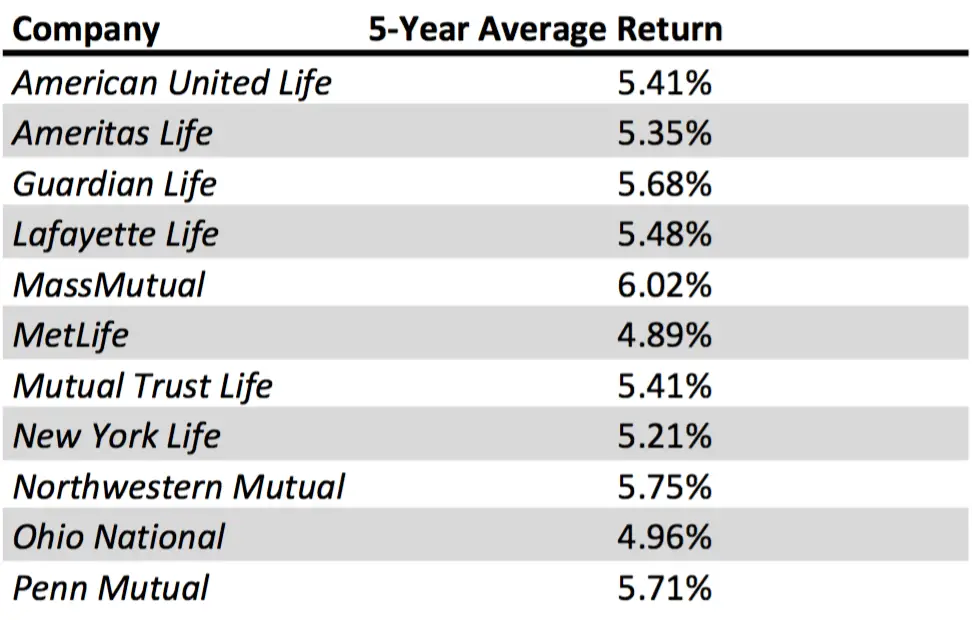
Second I’ll show you the five-year average total investment return results for each insurer. Again, the results are listed by alphabetical insurer name. The higher the number the “better” as the insurer achieved a higher return on invested assets.
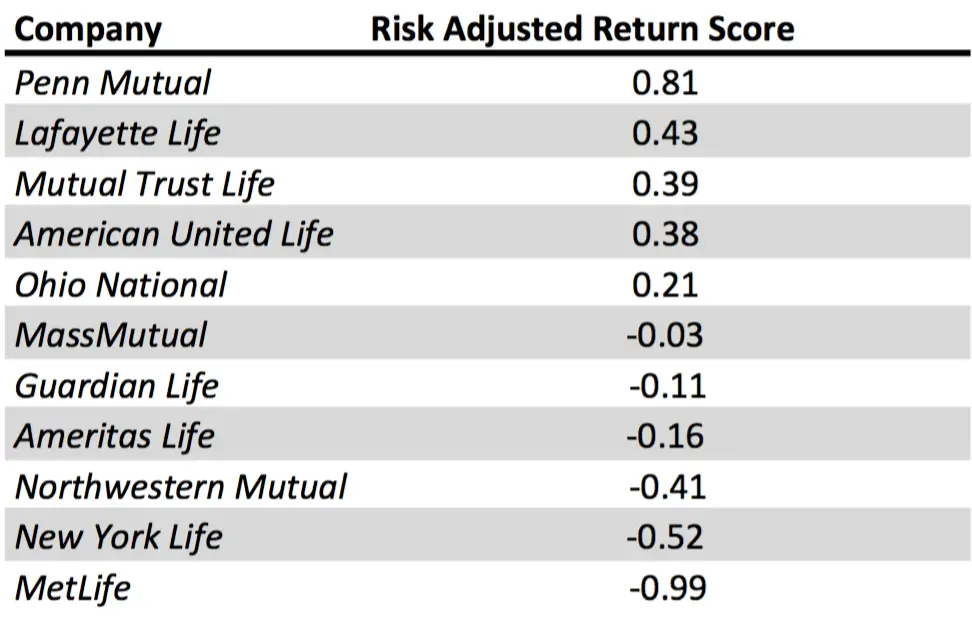
Now the ranking by our risk adjusted rate of return score. This table is sorted by score assigned to each insurer.
Commentary
It’s interesting to see that smaller insurers tend to have lower asset valuation reserve to statutory asset ratios implying they have less risky investment portfolios. Some of this may be due to necessity in terms of scale in the face of financial emergency.
The smaller insurers don’t necessarily achieve higher investment results, but the higher investment returns larger insurers achieve seems to involve somewhat disproportionately riskier investments.
It’s worth noting that for some insurers, lower investment results don’t necessarily mean worse results. For some insurers, assets a high enough to cover product goals without additional return on assets.
We’ve always used MetLife as an example of this notion. However, it’s noteworthy that MetLife ranks last in our risk adjusted return analysis, which implies that our once held belief that Met’s lower investment results were due to an intentionally lower risk profile is wrong.