

 Participating whole life insurance is a form of cash value life insurance that is often used with a focus on its cash accumulation capabilities and retirement income generating prospects.
In fact, we’d argue quite forcefully that if one wishes to use whole life insurance as an asset, participating is a key attribute to any chosen policy. And every time we reference whole life insurance for this purpose, we assume by default that the policy is a participating policy.
What does participating mean?
Merely that the policy participates in insurance company annual surplus (income in access of expenses) and earns a dividend as a method of paying this surplus back to policyholders.
Whole Life Insurance as a Retirement Income Source
Whole life insurance can be an extremely difficult product to understand for whatever reason. We’ve encountered plenty of licensed agents who couldn’t wrap their heads around what one can accomplish with this product (thankfully and sadly at the same time, many savvy consumers tend to show more mental flexing skills than these agents).
Life insurance used for this purpose takes on two forms, one of which is way more desirable—in my eyes at least—than the other.
- Death benefit with a coincidental cash value that could generate some retirement income
- Cash benefit focus that can generate a pretty respectable retirement income compared to other options with similar risk profiles
To help the newcomers, I’m not a big fan of option one, though sadly this is where a majority of agents focus their attention.
Design Complexity
Unlike universal life insurance, where we follow a pretty simple form factor to ensure a optimal design for cash accumulation purposes, whole life insurance tends to be a lot trickier. This doesn’t place it at any sort of disadvantage, and it certainly doesn’t mean we’d prefer universal life over whole life. It simply means it requires more work to get right.
Unfortunately, due to policy variances, what is available with one company’s product isn’t always available with a different company’s product. And because of this, companies tend to win the cash accumulation and income generation comparison not because they necessarily boast the best dividend interest rate, or lowest fees, but because their product(s) can be put together in ways that others’ can’t.
People have noted in the past that I’m noticeably less descriptive when it comes to discussing proper whole life design for cash purposes than I am when discussing universal life insurance. This variance in design options is the very reason behind this.
The General Pieces and Parts
Though it varies from company to company, there’s a general form factor, or targeted design that we’re always looking for across companies. This design is one that seeks to place as much of the outlay (annual premiums paid by the owner of the contract) into paid-up additions (or whatever the company calls them specifically) as possible.
This move gives us much greater control over policy reserve development, builds much quicker cash surrender value, and generally yields more dividends.
The restrictions that we face come in several different aspects, but there are two really big ones.
Paid-up Additions Restrictions
Since paid-up additions are the key feature we focus on, it makes sense to discuss them first. Many companies place restrictions on the amount of paid-up additions that can go into a contract. Most of the time, this restriction is a function of the base whole life premium (i.e. a multiple meaning paid-up additions can be no more than say 2 times the base whole life premium).
This situation of course causes us some trouble when we’re trying to make the base whole life premium as small as possible and the paid-up additions as large as possible given a planned outlay. But, we know who does what for this sort of restriction, so we know how to design a policy to perform its best. It’s often the case that a company who is more restrictive with respect to this performs less favorably compared to those with more liberal policies on this end.
Why would they restrict the paid-up additions rider?
This is a common question. And the answer is risk for the insurer. Keep in mind that paid-up additions are designed to keep the policy within 7702 compliance as per the Cash Accunulation Test (CVAT), so paid-up additions come with immediate cash value, and immediate death benefit that is larger than the income premium (i.e. $1 in paid-up additions may yield $3 in death benefit).
Due to this feature, insurers do worry and seek to restrict ones ability to carry a never-ending guaranteed death benefit increase option. Not doing this opens up considerable adverse selection risk (i.e. those who discovered they were soon to die, would suddenly place a significant amount of money into paid-up additions knowing that they immediately get more in death benefit than they put in).
Term Blending Restrictions
Most agents understand that term blending is a process for making whole life insurance “cheaper.” The term insurance coordinated with the whole life policy makes the required premium lower, and as a result of the insured gets a “permanent” policy for less money.
And, I’d argue, this is still the chief use among agents of this feature. But not mine.
Instead we use blending to increase the overall death benefit and, as such, increase the 7-Pay Premium. That’s the premium that tells us how much money can go into the policy before it turns into a modified endowment contract.
I don’t think I’ve ever explained the methodology quite in the following way, so in an attempt to push further clarity, here goes:
We can take a whole life policy and place a paid-up additions rider on the planned premium to increase the cash value performance (ignore the death benefit aspect of paid-up additions for a moment and think of it merely as a way to place extra money into the policy). The problem we face, is that we eventually run into the 7-Pay Premium. So in an attempt to increase the 7-Pay Premium, we use term insurance on top of the whole life policy to increase the amount of paid-up additions that can go into the policy.
If we work “backwards” we can take a planned outlay and figure out the proper term to base whole life blend to maximize the amount of paid-up additions to base whole life mix, thus ensuring we’re cutting base whole life expenses to their minimum and maximizing the one key feature when it comes to cash accumulation, paid-up additions.
This is all great, but some companies restrict the ratio of base whole life to term insurance more aggressively than others.
Performance will be more About Design Capabilities
I said all of this to reiterate the earlier point. Design is a key piece here. Some companies have great dividend rates, and great company investment performance, but their design issues leave them with lesser performing policy.
We do take company fundamentals very seriously, but we’re not going to sacrifice significant cash value or retirement income because the other lesser performing company has a better “story” behind it. At the same time, we’re not going to choose one company with bad fundamental just because it came out on the top of a list somewhere.
That’s why, as we’ve stated before, these comparisons are helpful in getting someone pointed in the right direction, they are not and should used as any sort of definitive answer regarding what company and what product any individual should use.
The Comparison
The comparison uses a 30 year old male issued at standard non-tobacco. This individual funds an optimally designed product at each carrier until age 65 and then takes income from age 66 to age 100. The policies all took advantage of the reduce paid-up non-forfeiture benefit after age 65. And we solved for a policy that remained in force until age 120 in all cases with one exception for National Life of Vermont as their software only allows a solve to age 100. Here’s the comparison:
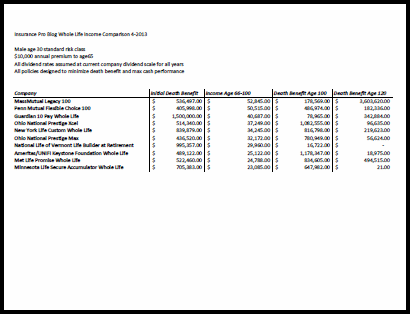
Some Explanation
Not surprisingly, the companies with the most accommodating design aspects to their whole life products rank best. Northwestern Mutual is missing from the comparison, and this is due to our limited access to designing their products, we are working on getting them into this comparison.
We chose to show two products from Ohio National to evaluate the performance between a product they suggest is automatically designed to be optimally designed without any tweaking on the behalf of the agent (Prestige Max) and a product that has required us to play around with their paid-up additions rider. Not all that shocking to us, a policy that focuses on paid-up additions performs better.
I’d also note that Ohio National actually has some additional design features that theoretically would make it perform even better. However, their product design software is extremely limited in terms of what it can show, so designing and comparing that precise strategy isn’t possible (a long standing criticism I’ve had of them that I’ve made them well aware of). In other words, I know (from experience) their products can be put together in a way to perform better, but I can’t show it on a policy illustration.
Guardian’s extremely large death benefit relative to everyone else is due to design requirements. Without all of the gory details, we can’t fund the policy through age 65 if we don’t design it this way. The extra death benefit doesn’t drag down performance as it’s mostly very cheap term insurance, and it’s not a bad additional feature.
In some real life circumstances we’ve opted for MassMutual’s 10 Pay over their paid-up at age 100 product. It always depends on specific situations, and we’d strongly encourage anyone to run both and compare. As is the case with the Guardian, MassMutual’s 10 Pay can be designed to accept paid-up additions beyond 10 years (a fact that seems elusive to a number of agents).
We opted for Penn Mutual’s paid-up at age 100 product over it’s paid-up at age 65 product. This is almost always the case for us, as the lower base whole life premium allows for more paid-up additions, which perform better.
One more Important Note
As you can plainly see from the comparison, there can be a pretty substantial swing in terms of benefit with one company vs. another. This is why a comparison is always a good idea. For the same premium we see a difference in projected retirement income of $29,760 between the top performer and the bottom performer. If you think participating whole life insurance makes sense for you as a low risk asset, insist that you see more than just one company’s product. And if you’d like more assistance with participating whole life or any life insurance product design, you can always reach out to us.
VERY enlightening study Brandon. This really puts this together for me quite well. Thank you. I do have some questions though…
Are these guaranteed values?
Why did the Mass Mutual db jump so dramatically from age 100 to age 120? This seems counter intuitive.
And finally… do you see any possibility for a third party software vendor offering a product that could allow agents to design policies across multiple carriers?
Andy
Hi Andy,
No these are projected values based on current dividends.
Dividend assumptions would be the reason behind the death benefit growth. Will it actually play out that way? I don’t honestly know.
I don’t see a third party software coming about that does this. The information is way too hard to get access to and the upkeep of that data would be nearly impossible.
Great Information, I love to read your articles as I am in the same biz.
As a side note, I run an illustration on the exact scenario as you show on this comparison, MM can show even better, 100k Base, 300K LISR, 53,127 Income from 65 to 100, although the DB is less, but the focus is on income.
keep up the good stuff.
joe
In this post, you mention the design restrictions surrounding paid up additions. Even though you provided the comparison chart with the implication being that the companies at the top of the list have the most permissive paid up additions requirements, would you consider providing a separate, pure list of companies in order of most preferential paid up additions design capabilities? I personally prefer to not bundle whole life with term, so this is why I am asking for a separate list that focuses exclusively on pua preferential treatment.
Hi Jimmy,
Thanks for the suggestion. The one small problem with the request is that some carriers would require blending in order to have flexibility–not all.
So, if we’re keeping this within the spirit of very cash rich policies designed for optimal cash performance via blending and paid-up additions, we’ll fail to meet the mark. If on the other hand, we just want a piece that talks about what carriers we can add a PUA rider to and have the highest degree of flexibility with respect to increasing or decreasing the amount of that PUA rider, we could do that. It wouldn’t really be related to what we’re focusing on here, but we could do it.
Mr. Roberts,
Thank you for responding to my question. If it makes more sense to do a short piece discussing carriers that offer a PUA and the flexibility therein, then please allow me to amend my request to encompass that effort. I was unaware that some companies may require blending as a gateway to flexibility, and I certainly wouldn’t want to put you or your team in the position of missing the mark. I find your blog to be highly informative, precise, and succinct…something for which I am very grateful. Ultimately, I happily defer to your judgment regarding my request. If I may be so bold, I believe a “master table” or some such type of chart or document that details the characteristics of carriers with regards to policy design would be valuable. I have yet to find such a table or chart elsewhere, and I have the utmost confidence that you and your team could produce a superb product. Thanks again for responding.
I am currently researching life insurance products, and recently stumbled across your blog. It has been both interesting and informative, and for this I want to thank you. I have decided to purchase a blended Guardian 10 Pay WL policy, with the main goal of building cash value efficiently. With this in mind, I am hopeful that you can provide some basic advice concerning the optimal blend ratio of Term to WL, as well as which riders I should add and how best to utilize them. I wish to maximize the use of PUAs, and can afford to contribute approximately $20,000 per year. Your thoughts would be greatly appreciated.
Hi Jonny,
Please contact us directly.
Clicking the “click image to enlarge” button does not enlarge the image.
Thanks for letting us know, a weird thing indeed that I will have to explore more deeply. Sorry for the confusion.
Great blog and podcast. I recently did some research and looked at a few different policy designs from Mass Mutual, American United and Penn Mutual. I ended up going with Penn due to the cash accumulation (both guaranteed and projected at current div rate) plus the flexibility and chronic illness, overloan protection, etc. Your podcast made me feel more comfortable with my decision. Thanks guys! I may adopt another policy(ies) in the future for my spouse and or children.