

 Maybe you’ve heard this one before, the claim that mutual life insurance companies are better than public life insurers. Of course, the mutual life insurers all think so. But we’re willing to bet that the so-called public life insurers would tell you differently.
So is it true that the non-mutual life insurers are just out to swindle everyone out of their money and represent all that is wrong with American capitalism? Or are the mutual just stodgy companies that have a problem embracing modernity…and the capital markets. 😉
Let’s Set the Stage
So a little background is in order. Mutuality is arguably the original insurance design. At least this is what you’ll hear if you let a mutual company employee tell you the story. In truth insurance actually gets the majority of its origins more from fraternals/benefits societies but those are details and who has time for details?
The claim is that mutuality is the natural starting point for an insurance company. A provider of insurance places ownership in the company in the hands of the individuals who hold insurance policies from the company. Because of this, the company is beholden to its policy holders and this perfectly aligns the company’s values and goals with the policy holders’ values and goals.
She’s Gone Public
Excuse me for making an obscure reference to a country music song I can’t actually tell you the name of (I’m the one from Vermont). Starting about two decades ago, several mutual companies decided to ditch the restrictive nature of mutuality and go public. Doing so enables them to raise capital via the U.S. capital markets (i.e. selling pieces of yourself or issuing public debt, though mutuals have some choices regarding that last one, just not quite in the same way).
This corporate structure turns the company into a public corporation, one with stock holders and a board of directors whose fiduciary responsibility is to deliver profits to those stock holders who may or may not be policy holders. There’s no requirement to be a policy holder, you simply have to pony up cash to buy company stock. This very fact, according to the mutuals is pure evil.
Us vs. Them…we have a Problem
The first big problem we have in comparing company structure is that fact that it’s not so clean cut. The world isn’t just consumed by mutual insurers and public company insurers. No, that would be too easy. In addition we have other corporate structures like privately held insurance companies, or insurance companies held by a corporate entity known as a mutual holding company. While neither of these companies have public stock holders, ownership depends on structure.
For some ownership may be placed with a individual or corporate entity, for others ownership rests with the policy holders…sort of.
We’d be terribly remiss if we pretended that this third category didn’t exist. And in truth it’s more like a 3rd, 4th, 5th, and so on category, but for simplicity’s sake, we’re going to combine them all into a catchall category. Not quite mutual, and not quite public.
Us vs. them vs. them
So now that we understand there are actually three different categories, the question still remains. Is one really better than the other? The mutuals, of course, would still have you believe that nothing but pure mutuality is worth your time. The public companies would highlight their access to quick cash when in need, and the third group we just learned existed would have some great story we’re quite sure to highlight why they are special (probably something in between the other two).
But for those of you who have spent any time reading anything else I’ve written, you likely know that I’m not big on feel good stories. I like numbers, because numbers tell truths. So, let’s try to quantify this just a bit.
Methodology
I’ve broken life insurers into the following three categories:
- Public Insurers, which is actually insurance companies owned by public companies (more on that in just a minute
- Mutual Insurers
- Hybrid, the catch all category that represents companies that are owned by private entities or mutual holdings companies
I took the top eight companies—top eight due to limitations of Ebix’s Vital Signs software—in each category ranked by general account size as of the 2011 issue of the American Council of Life Insurer’s Handbook (2011 happens to the best the latest edition I have in my possession).
I specified insurers owned by public companies above because life insurance companies themselves are rarely public companies. Instead, a public entity like a financial holding companies tends to own the insurer. In these cases I used only the major insurer owned by the public entity. For example, MetLife, Prudential and American General are companies represented by the public company cohort. And the actual public company in all three cases is a holdings company that owns numerous insurers.
So, I’ve taken data from the Metropolitan Life Insurance Company, the Prudential Insurance Company of America, and American General Life Insurance company only (none of their sister companies were included).
At the same time I should specify that I only used the primary insurance company when evaluating the mutual insurers. For example, New York Life is a mutual life insurer that happens to own an extremely large insurer whose primary function is to manufacture annuity products. That subsidiary company was not included in the mutual companies.
The hybrids vary quite a bit. From the somewhat awkward not-for-profit insurer TIAA-CREF to bona-fide mutual holdings companies like Pacific Life and Ohio National to privately held insurers like Midland National.
I then looked at the following eight (this time no limitations, that’s just the number it comes out to) critical company performance metrics:
- Surplus Ratio
- Average 5 Year Total Investment Return
- Risk Based Capital Ratio
- Dividends Paid in 2011 among all companies in the category
- Average Expense Ratio
- Average Interest Margin
- Interest Payments
- Total Insurance Inforce
This last one has nothing to do with soundness of the company, and everything to do with keeping a few other metrics in relative perspective.
Results
I’m going to walk through each category and explain what we’re looking at and why. And then give the results among the categories of companies.
Surplus Ratio
Surplus ratio tells us the amount of capital the company holds in excess of its legally required reserves relative to the total size of the company. For example, if insurance company A has $100 billion in assets and holds $10 billion in access capital (above reserves) than it’s ratio is 10%, the higher the ratio the better in most cases. You could also think of this as the rainy day fund in a crude sense.
This is a metric that the mutuals spend a lot of time talking about. Their conservative nature, and in some cases statutory requirements, leave them with usually high surplus ratios. So how do they stack up to everyone else?

As you can see they certainly boast surplus well in access of their public company counterparts. But this isn’t a category they dominate. The Hybrids actually maintain slightly better surplus positions on average. Meaning they too could be considered just as secure with respect to saving for a rainy day.
Average Investment Return
I’ve talked about the importance of investment return on the general account before. This is a metric that shows us how well the insurance company's CIO is doing with company assets, and helps us predict to some degree how successful the company will be at maintaining competitively priced products and yielding attractive returns on their cash value focused products.
This is a category all insurers would like to boast superiority in, so who comes out on top? The hybrids win, again.
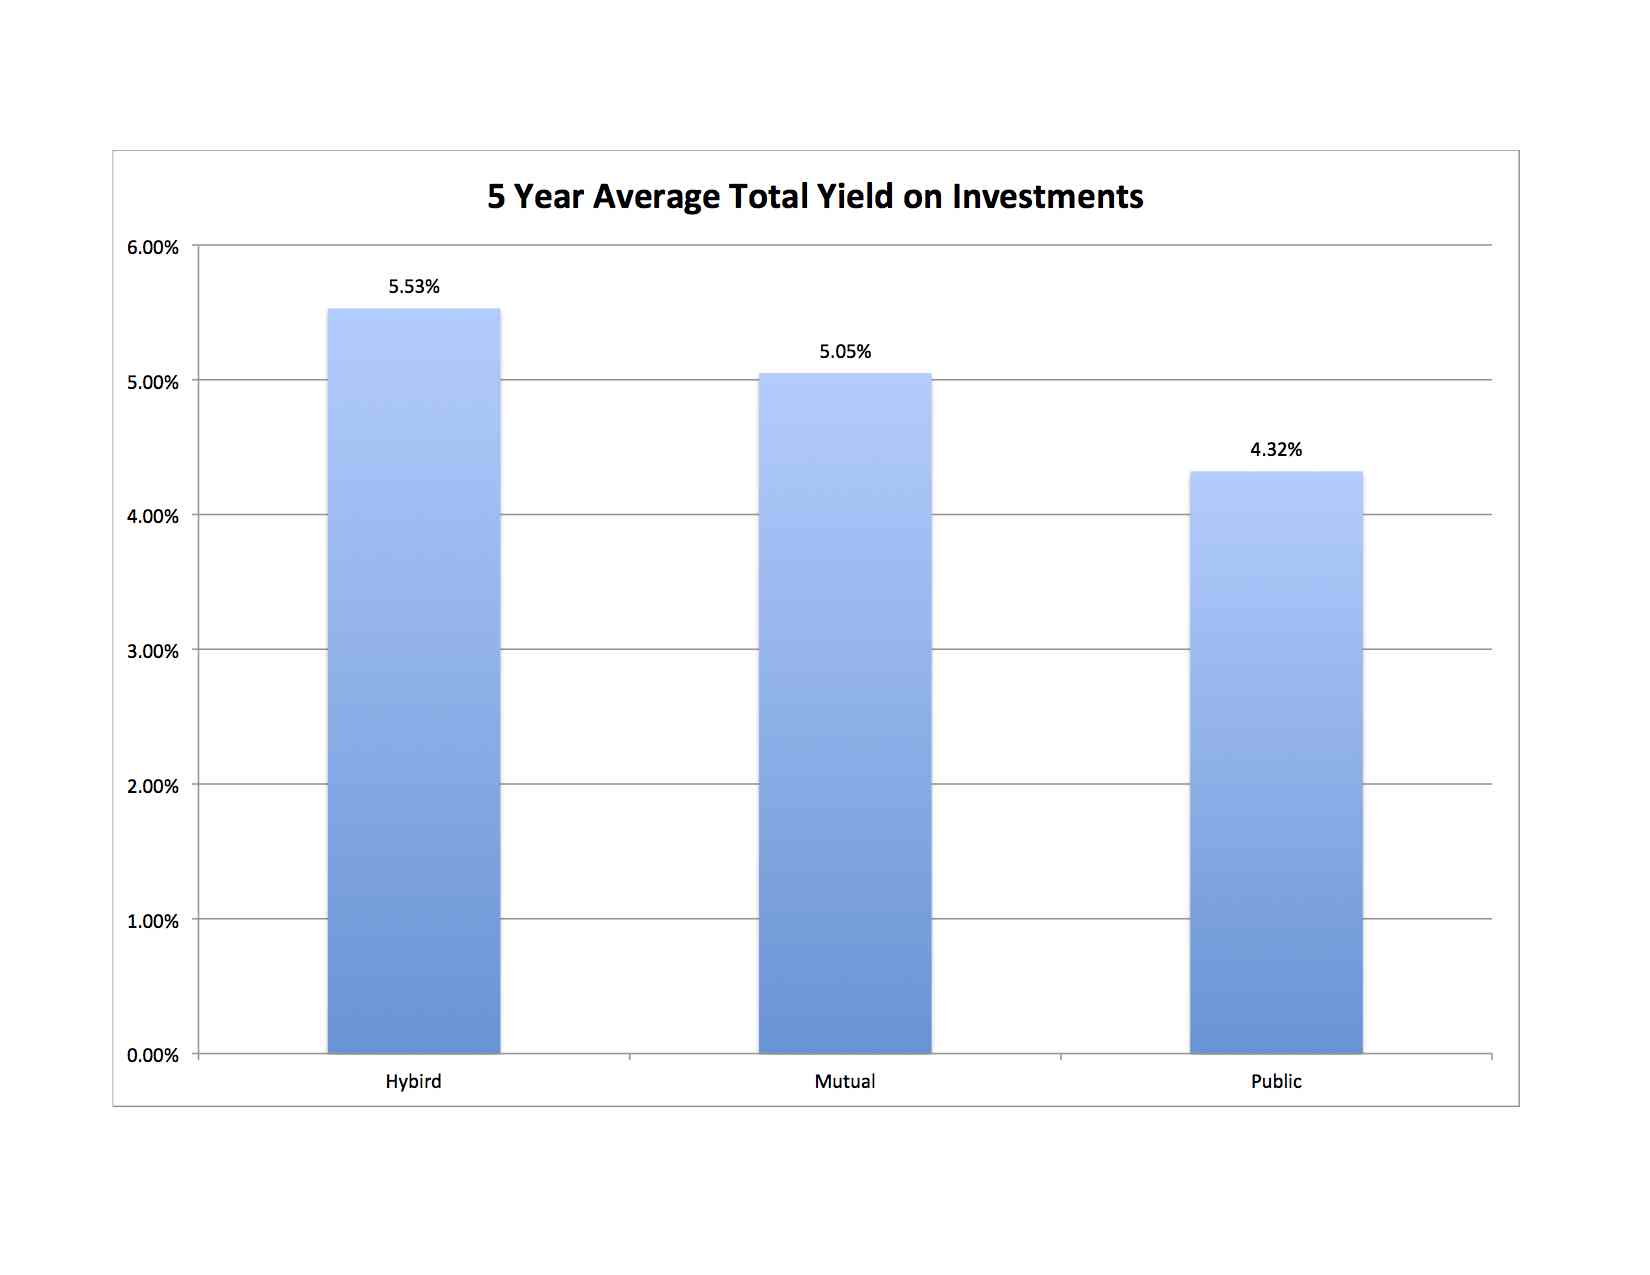
This is interesting and some what counter intuitive. In large part because (as I’ll detail later) the hybrids mostly make up much smaller life insurers. Theoretically the larger companies should be able to attract top talent. Who doesn’t want to say I’m an investment strategist for Prudential vs. saying I’m an investment strategist for American United Life Insurance…who the heck are they?)
Risk Based Capital Ratio
Risk Based Capital Ratio represents the amount of capital the insurer has above it’s legally required reserves adjusted for default risk. Like the surplus ratio it’s another rainy day fund-like measure where the larger the number the better. Of course then, it seems obvious that this would be another metric the mutuals are all over.
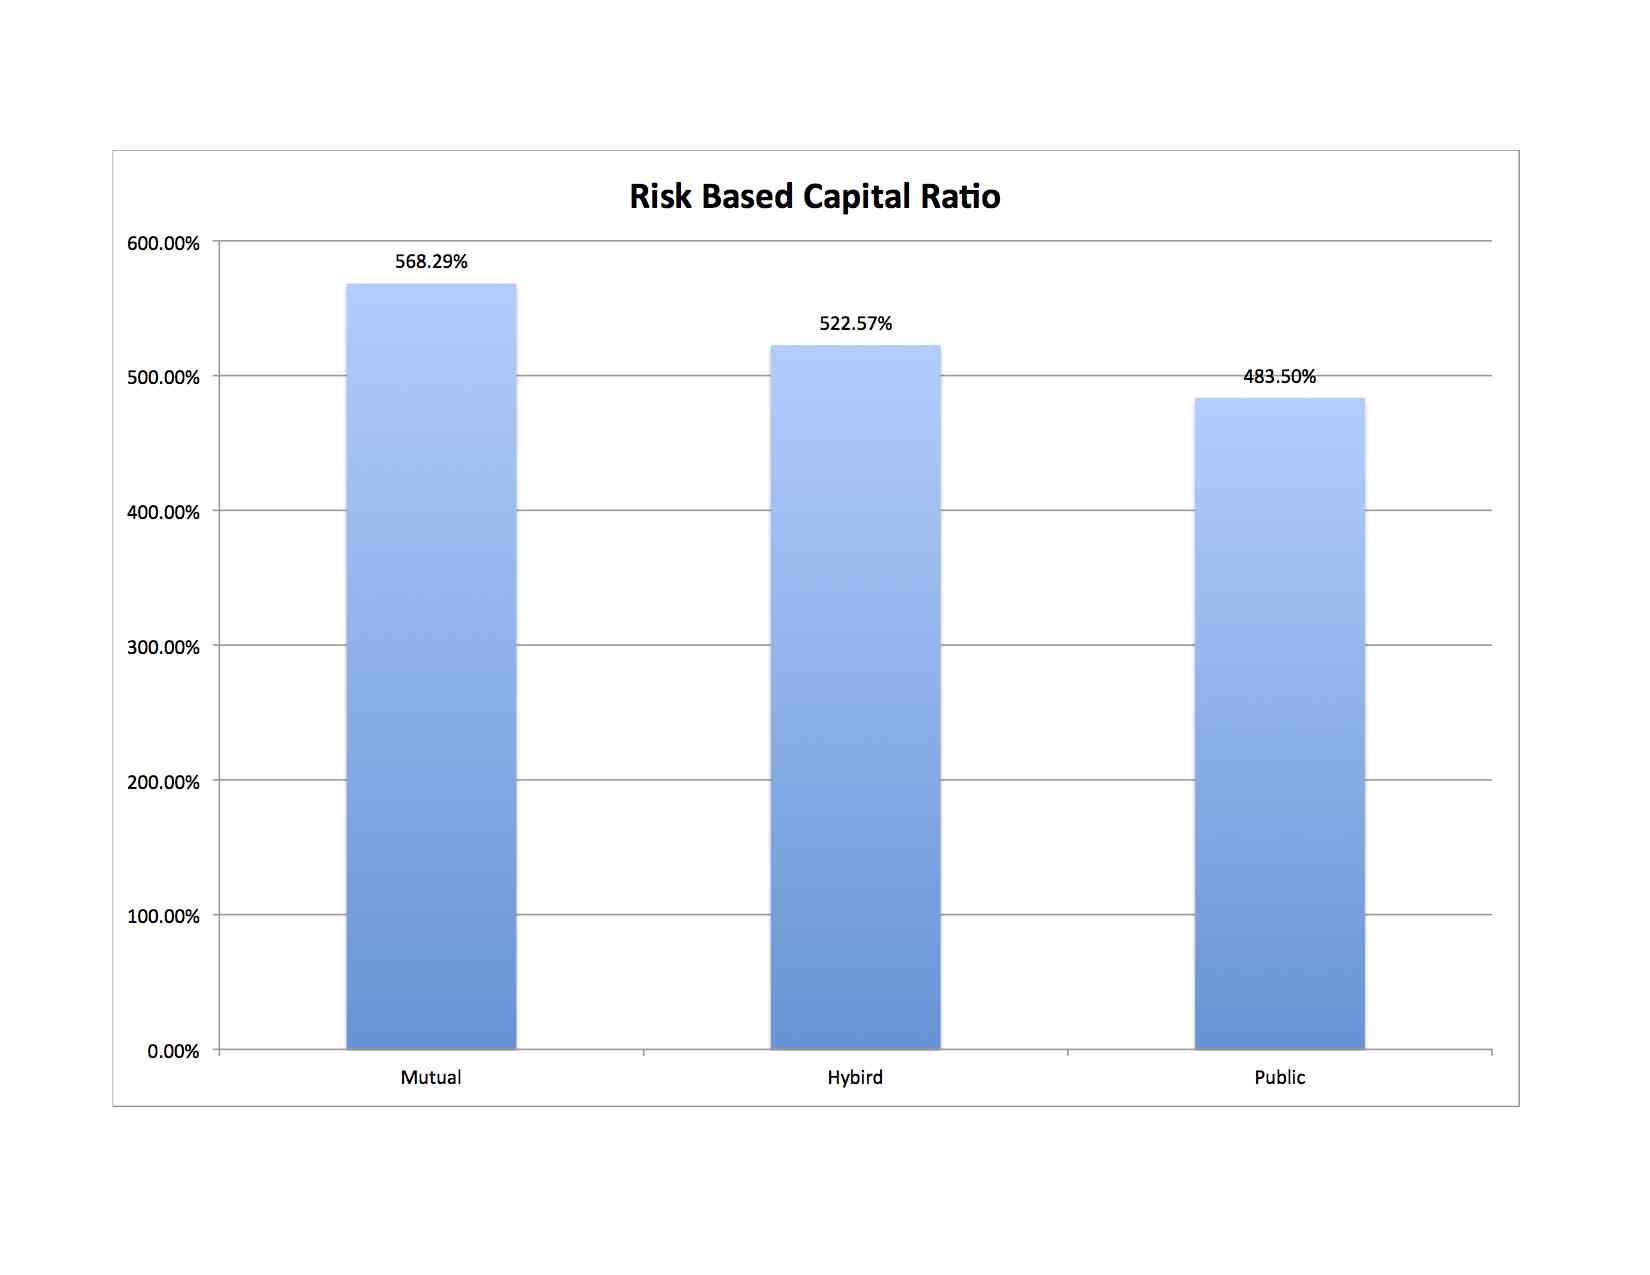
And the finally win one. The average for the industry is about 490% for those who wish to keep score, so the result from the public companies isn’t exactly exciting.
Total Dividend Payout
This is simply the amount of policy holder dividends paid out by the insurer in 2011. We’d anticipate this to be a category easily won by the mutuals, and it is.
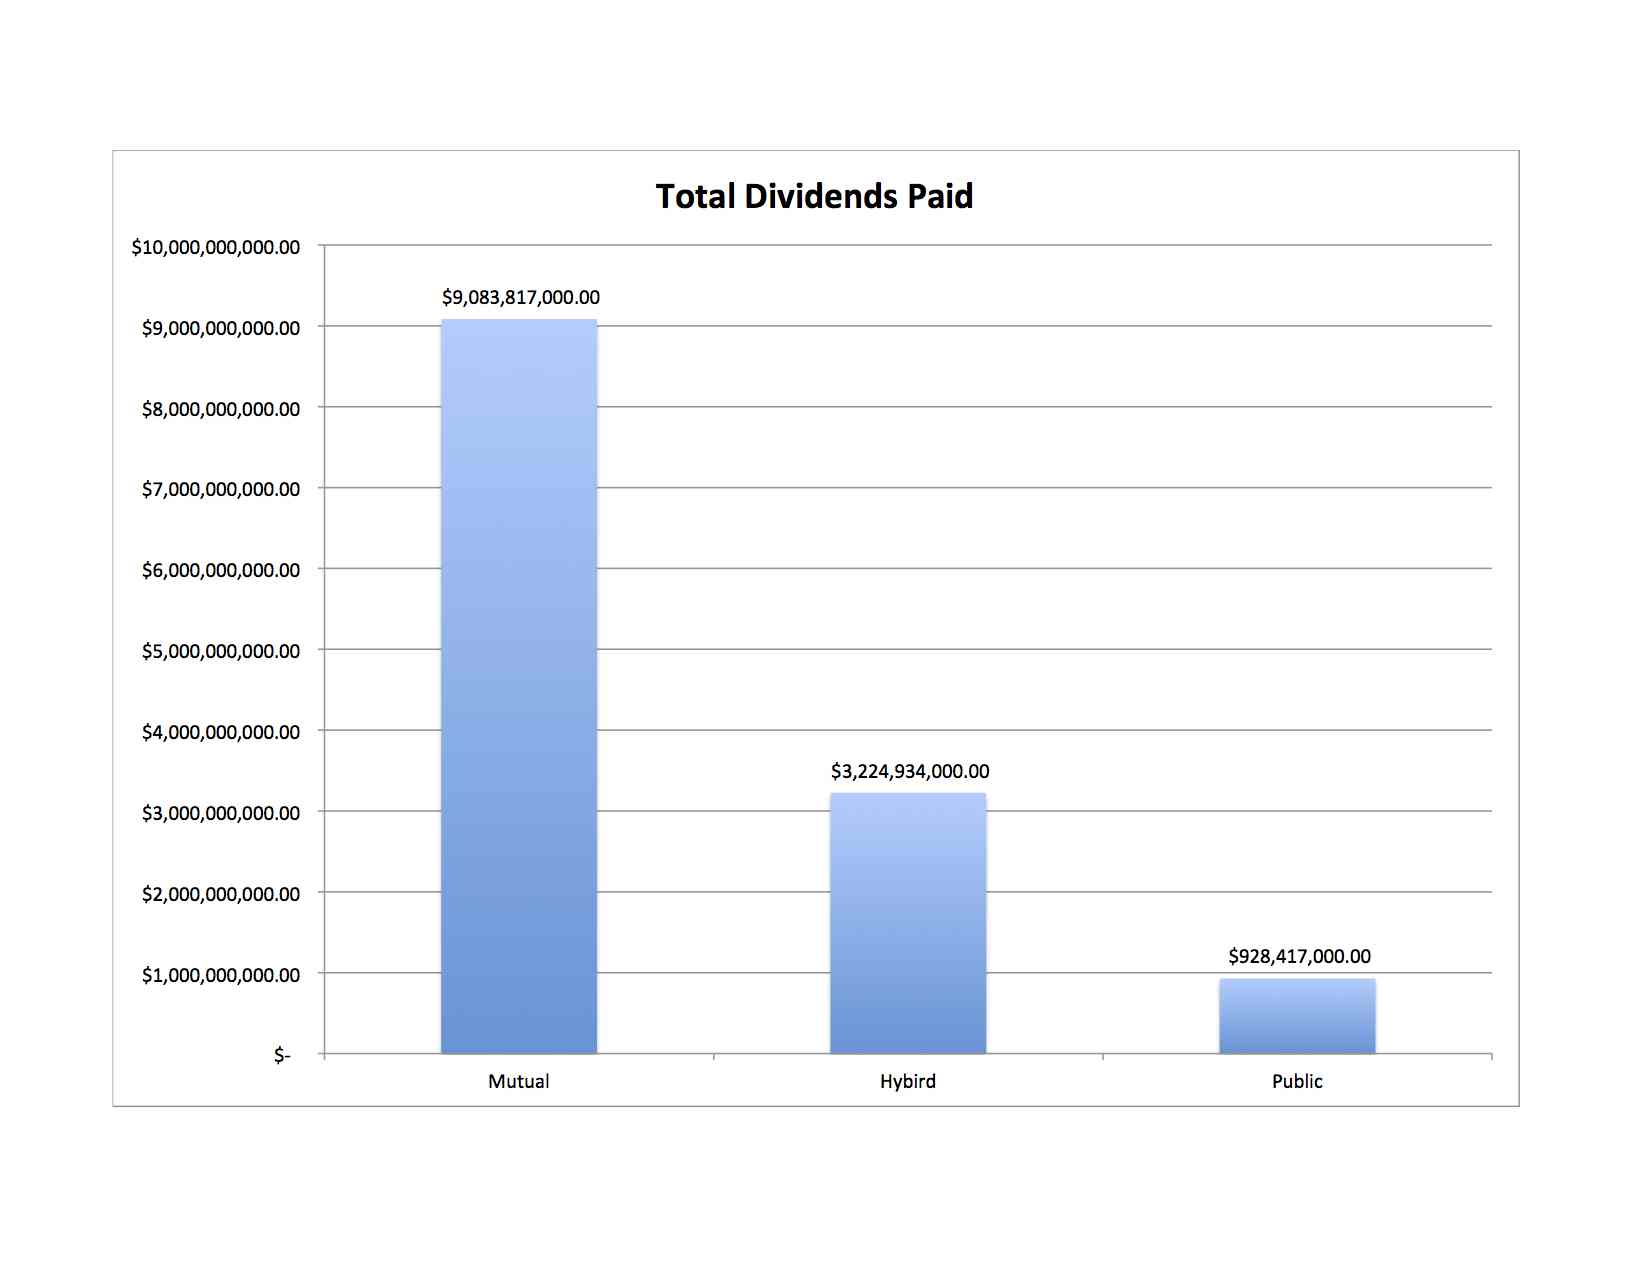
The Mutuals pay out more than the other two categories combined times two. But there were some honorable mentions within the other cohorts. Like TIAA-CREF’s $3 billion in dividend payouts in the hybrid category and Prudential’s coming in 2nd place (behind Axa) for dividend payouts in the public category, despite the fact that Pru hasn’t issued a participating policy in well over a decade—it also speaks volumes about the fact that they beat out MetLife where participating whole life insurance is still an available product.
Expense Ratio
In this case we’re taking the companies’ revenue and dividing it by general operating expenses and selling expenses (i.e. commissions paid). This is a common metric that the industry discusses, and one that indicates good operational expense management through a lower number.
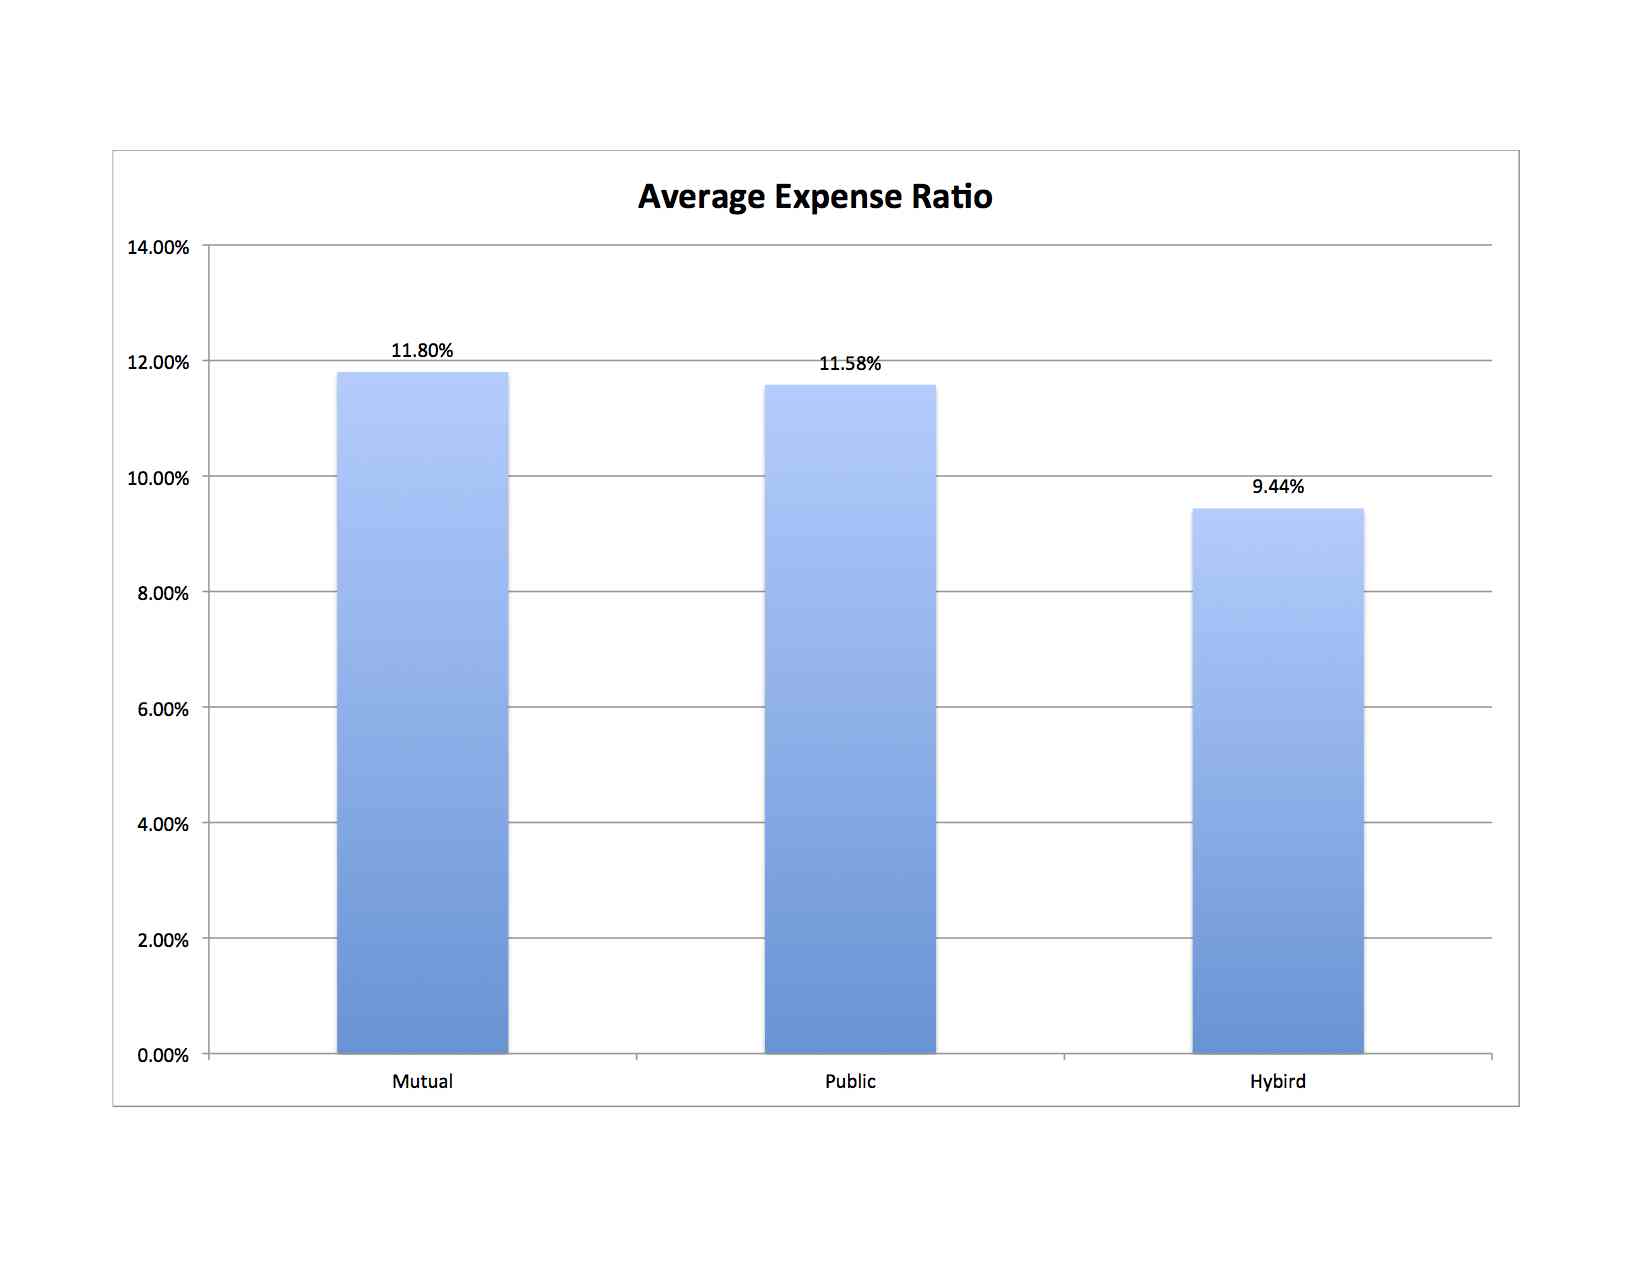
The Hyrbrids win this one pretty handily. Interestingly the mutuals come in last place, despite many of them making claims that they excel at this. To be fair, it is somewhat odd that the public companies can’t dominate this category. They are much larger than both of the other two categories and there ought to be a scalability to expense management. On the flip side, it’s truly noteworthy that the hybrids can pull off such a spread between them and the other two categories given their generally smaller size.
Interest Margin
Interest margin is the spread between what a company must pay out in benefits or reserve building requirements and what they actually earn on their investable assets, the higher the number the better.

The Public companies finally have a metric to dominate, and if your going to boast supremacy on any of them, this one is arguably on the of the more important ones. This spread speaks to overall profitability, and one average the public companies payout in interest obligations only half of what they earn from investment yields.
Total Interest Payments
While it’s not a perfect analog, total interest payments give us some insight into policy-holder benefit payments that are no dividends.
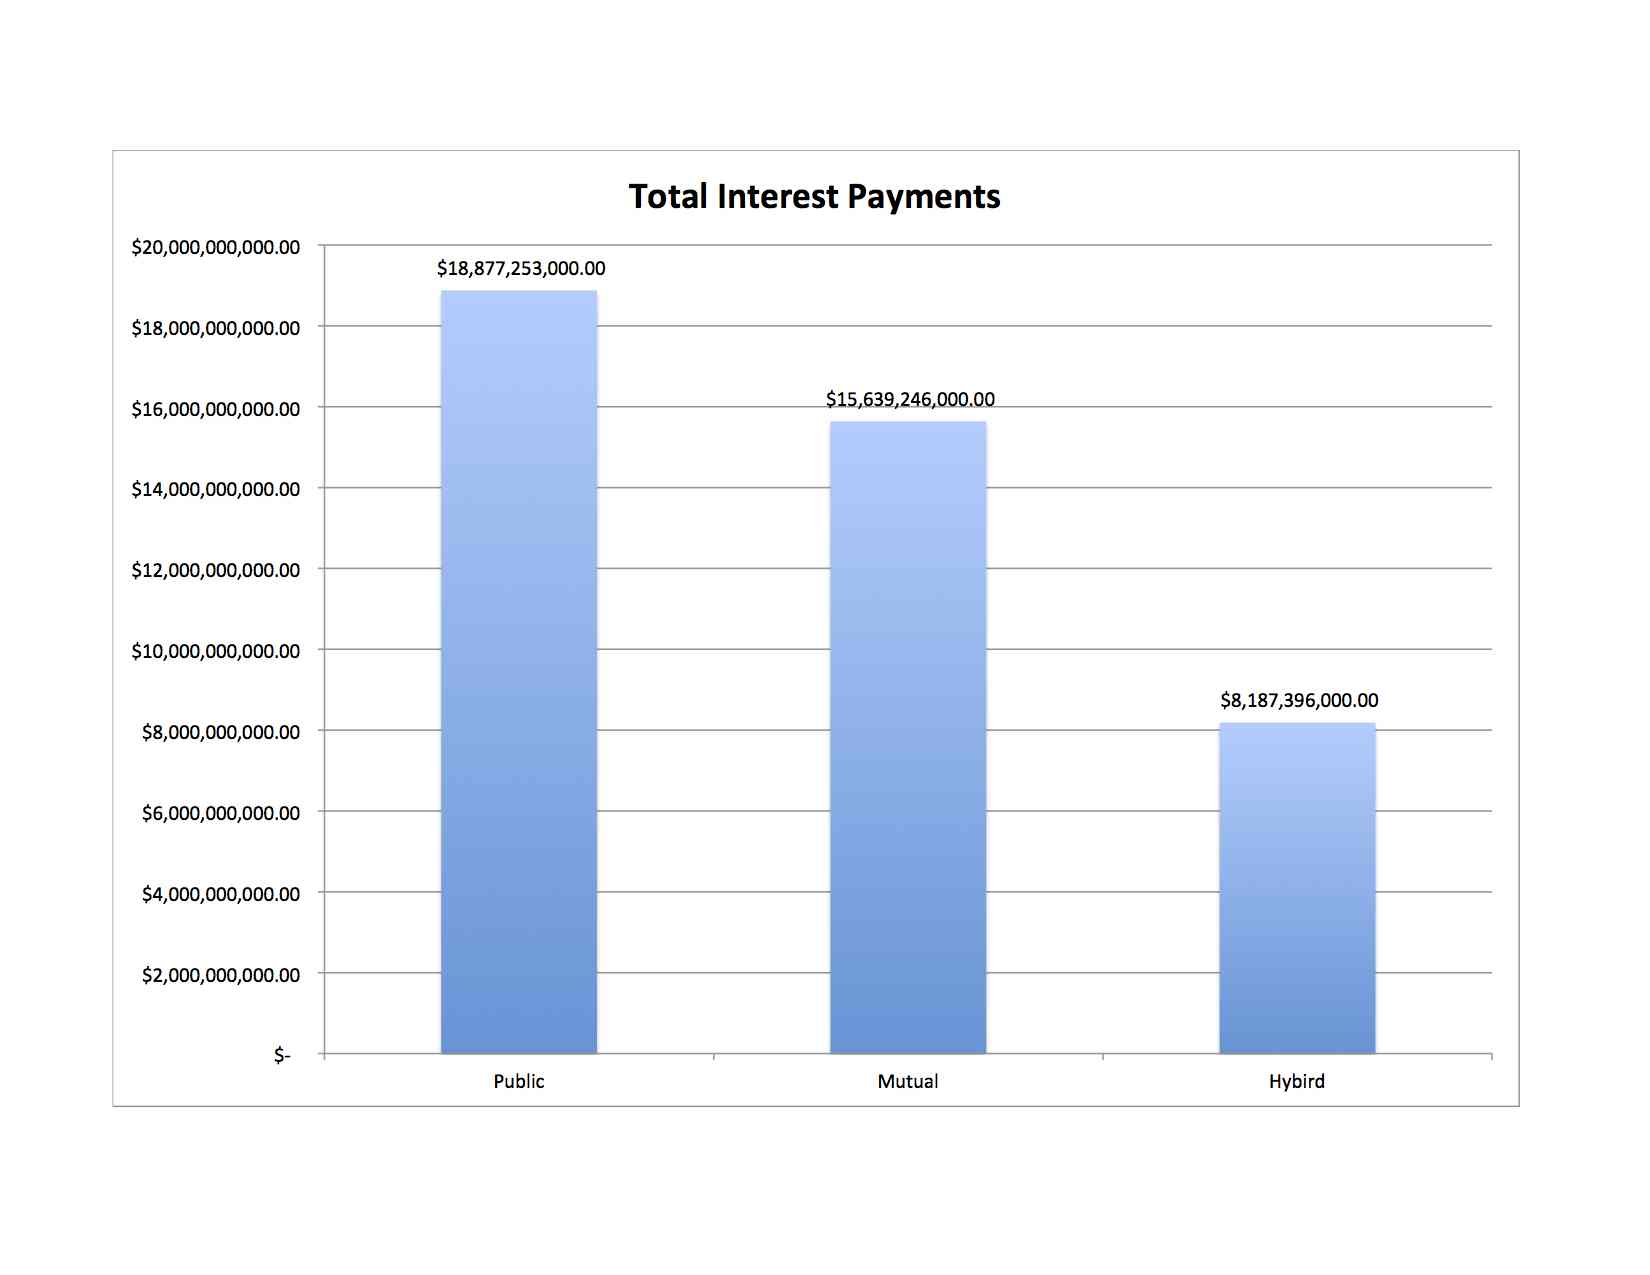
Another win for the Public companies.
Total Ordinary Life Insurance Inforce Policies
Most of the metrics we’ve reviewed so far are relatively hard to compare across categories without something to anchor their relativity. For example, does the fact that the hybrids only pay out a little less than $7 billion in interest obligations make them bad? We can’t really answer that without some understanding of how large the pool of policy-holders is. To look at that, we look at total ordinary policies inforce.
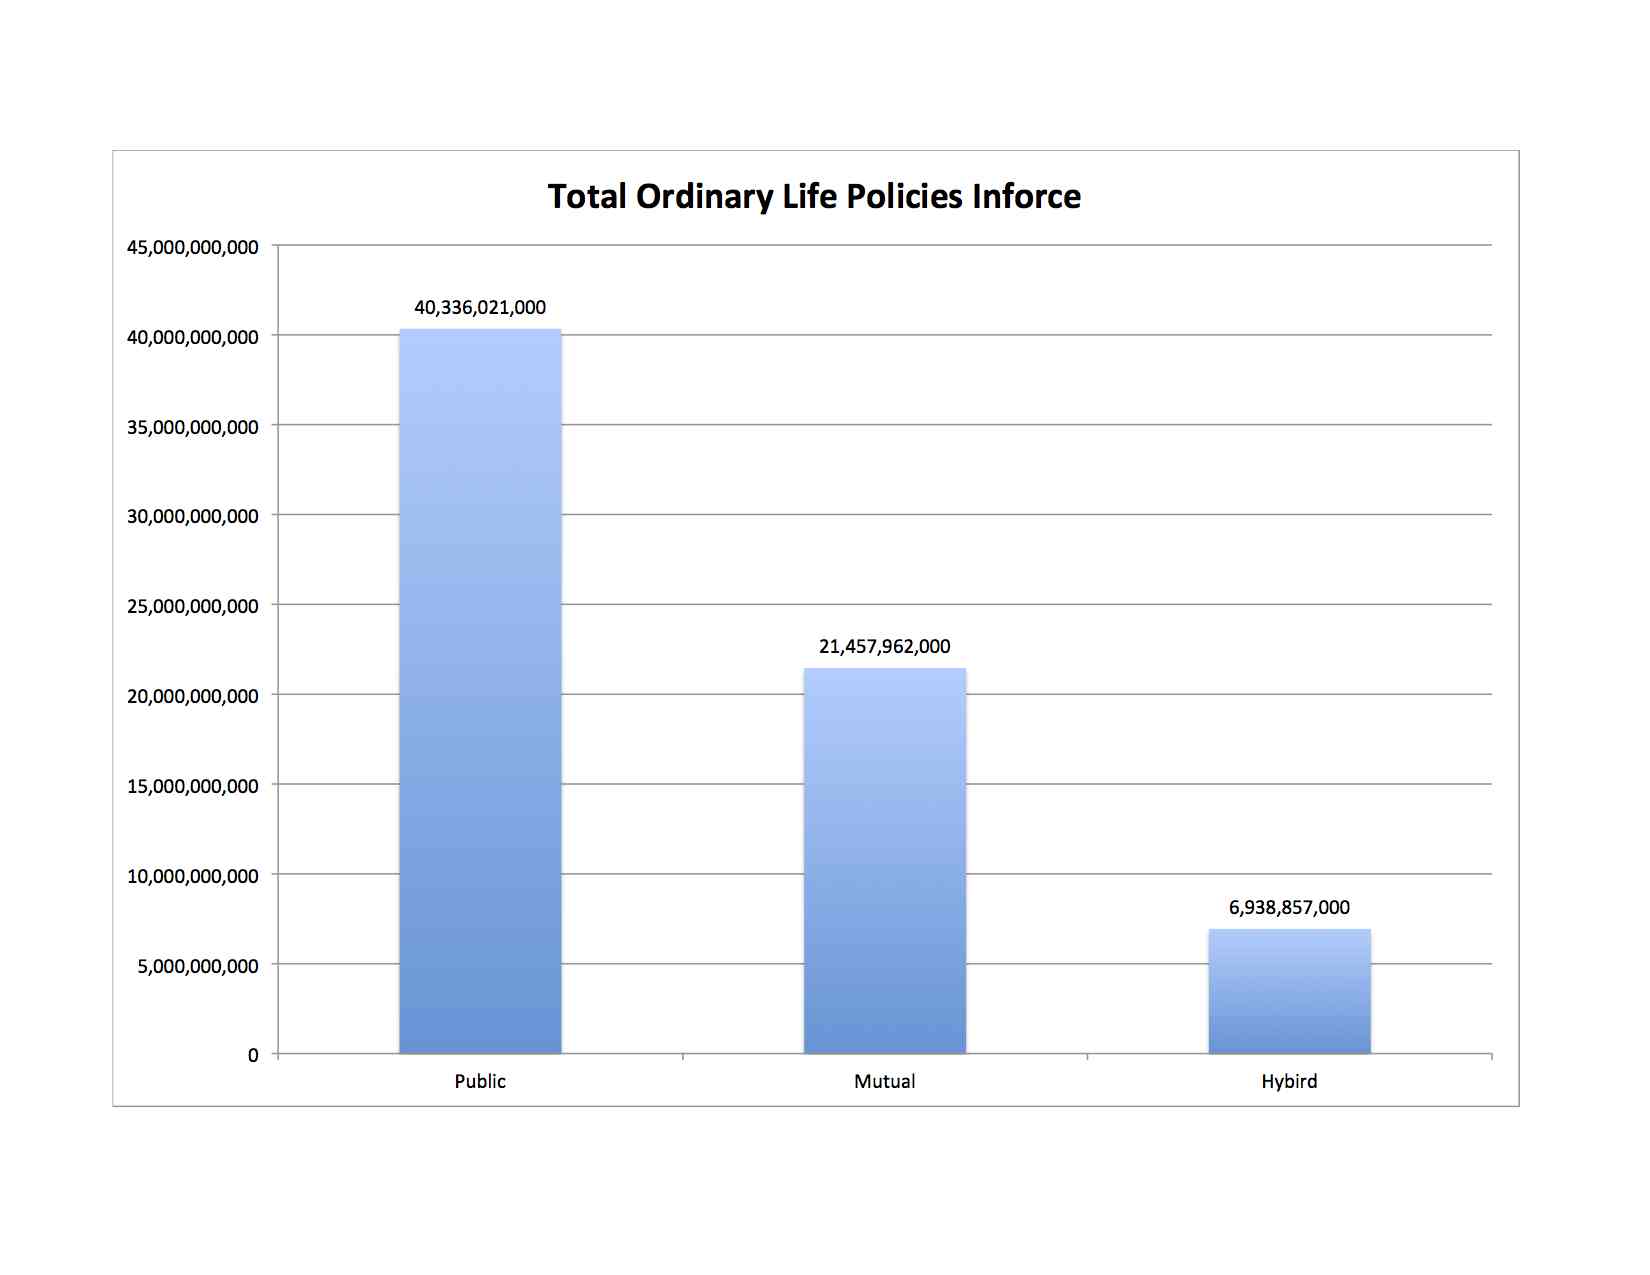
This is fairly interesting. As we can see that the public companies have a lot of policies in force relative to the other two cohorts. This also would suggest that we’d reasonably want to see a scaled disparity between something like interest payments comparing public companies to the other two cohorts but that doesn’t seem to be the case. Keep in mind, though, that the interest payments metric isn’t a perfect representation of benefits paid to policy holders, though it does capture a large piece of it.
Additional Thoughts
So now we must come back to the original consideration and keep and perhaps cave to the need to discuss things in a more philosophical nature and less of a quantitative nature.
It’s important to note a point I made earlier which is public insurers are insurance companies that are usually owned by public financial companies. So the original insurer remains intact and continues to operate (at least to some degree) as the insurer it always was. It’s unfair to categorical declare all publicly owned life insurers have forsaken their policy-holders and now exist for the benefit of stock holders.
But, there’s certainly quantifiable evidence that there could be something going on that tends to cause the public companies to—on the whole—produce lower benefits (with respect to “living” benefits) to the policy-holder. It’s hard to overlook the fact that the mutuals payout more in terms of interest payments and dividends than the public companies payout especially keeping in mind that the mutuals are doing this on about one-half of the total outstanding policies.
We could also potentially turn the superlative interest margin results among the public companies on its head and claim that they have additional money to augment policy-holder performance, but choose not to. That’s a potential mistake, however, as we’ve not spent enough time looking into just how much money we’re talking in access of requirements, and paying that out to policy holders may be insignificant in terms of benefits.
Theoretically it makes sense that the public companies would want to derive more net income from each insurer is owns so as to boost total net income at the holding company.
Perhaps then it’s fair to say that within the public arena there is simply a different approach and one should plan accordingly. For example, among the cohorts we know from experience and industry reputation that the public companies hold most of the insurers who are top of mind for impaired risk underwriting (i.e. issuing insurance policies on people who need death benefit, and who have health circumstances that would leave them in less favorable underwriting risk classes). This is not something the mutuals or the hybrid companies are generally well regarded to handle. Given this, we can’t rule out the importance the public companies play, because better doesn’t have a universal application.
The Hybrids
We also can’t overlook the performance of the hybrids, and we must keep in mind just how idiosyncratic and varied they can be. Some are close in nature to mutuality, while others are closer in nature to the public company model. Despite this, they all appear to have exceptionally sound business models and deliver a high amount of policy-owner benefit relative to their respective piece of the pie.
Let’s not be to Hasty in Accepting the Macro Trend
Just like the direct-recognition vs. non-direct recognition debate, it’s not true that one is categorically better than the other. While it would appear that on average the mutuals tends to be better bets with respect to policy-holder benfits, there are public companies that have delivered incredible benefits to their policy holders. Being mutual, or hybrid, may be beneficial but one shouldn’t accept a company based on this attribute alone.
Insurance is a very customizable product, so there are additional considerations that one should look into when figuring out what product and what company is a best match for them. It may be a mutual life insurance company, but it could also potentially be a public life insurer.
Regarding Surplus Ratio
Did you mean “excess” capital, as in exceeding reserves, or it is “access” as in able to be accessed readily?
Regarding Average Investment Return
You mention that the Hybrid companies, which generally comprise smaller insurers, have a higher average investment return, and you mention this is somewhat counter intuitive since the investment “talent” ought to gravitate toward the larger organizations with more to invest. Does this perhaps show that the talent is not as talented as they think they are? Or is this merely a case of smaller amounts can be directed at the limited pool or better-returning opportunities than the larger amounts?
I really do enjoy the numbers blog posts!
-Jeff
Nope totally meant excess. Thanks for pointing that out Jeff.
As for the return. It’s a bit of a mystery. Perhaps the talented CFA’s aren’t as talented as once thought. Or some of it may be due to the sheer scale. There have been a few studies that point out American Funds has–at times–been plagued by the size of their assets under management as they can’t find enough investment options to direct money and/or cannot act as nimbly when things take a sharp turn due to the trade volume a shift in focus requires.
This same aspect could be at play as the the public companies are dealing with general accounts that often times run into the hundreds of billions of dollars while the hybrids were typically dealing in tens of billions.
Theoretically the public companies could push back a bit and suggest that in absolute terms, the yield from an asset it dramatically larger at what appear to be smaller yields due to the size of the assets. They don’t need the additional yield to be profitable and trying to achieve it subjects them to additional risk that they’d rather not assume. And in many respects I’d be quite comfortable with that explanation. We do know by comparing this metric against interest margin that, despite the lower average yield, they still maintain a much wider spread between what they have to payout in interest payments and what they bring in from investment income on average vs. the other two cohorts.